How have Labour leaders in opposition done in local elections?
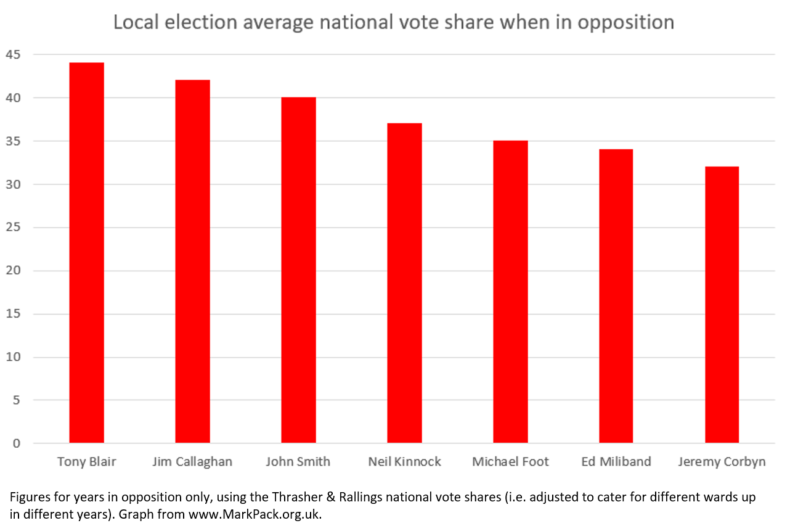
The following graph shows all the leaders of the Labour Party who have been in post when the party has been in opposition at the time of at least one round of annual council elections.
For each of them, I have calculated the average share of the vote for the Labour Party in those rounds of local elections whilst in opposition in Parliament. The vote share calculations use the Thrasher & Rallings national vote share calculations, i.e. they are adjusted to allow for different wards being up for election each year. Therefore the different performance of different leaders isn’t due to which wards were up in the years they were in post – the figures are adjusted to cater for this.
And with that, here’s the data:
To see the full context of the predictions and results each year, see my PollBase collection of local election results.
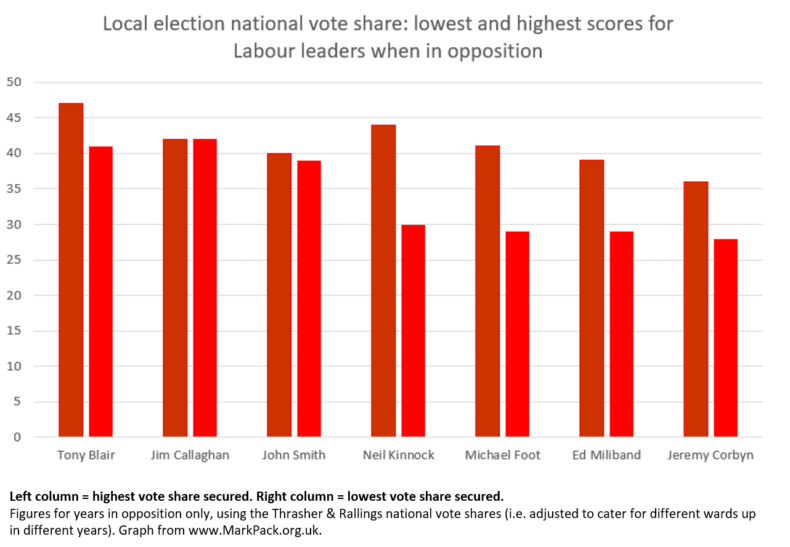
UPDATE: In response to a query on Twitter from James Morris, here’s also a graph that shows their highest and lowest performance.
As you’ll have seen from the above graph, Jeremy Corbyn‘s average is the worst. What this additional graph also shows is that even the post-Corbyn surge, Corbyn is still performing poorly.
He has the worst average, the worst lowest score and also the worst highest score of any Labour opposition leader since this data started.
Some pundits said on May 3rd that Labour/Tories tied on 35% would yield a LB maj of 3 in equivalent GL and L/D 16% would yield a lower return of MPs proportionate to national increase by 3%, when should be higher, under fairer PR.Does this scale indicate that Labour are relatively weaker over time, despite having more members under Corbyn?Can we infer from this evidence that there will be a `Hung Parliament’ next time in GL?
I made much the same point with these data:
Labour Performance in Local Elections since 1979 – Year after GE; percentage of vote; Leader
1980 42 Foot
1984 37 Kinnock
1988 38 Kinnock
1993 39 Smith
1998 37 Blair
2002 33 Blair
2006 26 Blair
2011 37 Miliband
2016 33 Corbyn
2018 35 Corbyn
AVERAGE 35.7
Corbyn is at best average and a long behind the scores in periods of Opposition. Which won’t stop the Corbynistas massaging the figures of course.
No mention of Hugh Gaitskell under whom Labour lost several hundred seats in the local elections of 1960 & 1961. Labour still went on to win in 1964.
The data series don’t go back that far for local government vote shares I’m afraid. Which is a shame as data with Gaitskell, Wilson and Attlee would be fun!
Jim Callaghan was before my time here, but one thing I remember is that both Tony Blair and John Smith before him personally had good press. The favourable media coverage gave each of them gravitas. Also, John Major, the PM at the time was much satirized and even ridiculed for being a weak leader of his own party that feuded internally (anyone remember him as an ashen grey man on Spitting Image?).
I am surprised how high Corbyn is. Surely, even ardent socialists must recognise that he has not been an effective leader of the opposition?
Perhaps the approval of the opposition leader is more dependent on how the sitting MP is viewed than on their own performance.