Oxbridge admissions: what the numbers actually say
It’s almost become a political cliché to quote the (apparently) (appallingly) (allegedly) [delete to taste] low number of black students being accepted to Oxford and Cambridge Universities. But for all the widespread quoting of those numbers, there is very little done usually to put the numbers in context.
So here’s a simple chart that compares the actual admission figures for black students with what they would be if if the proportion of acceptances who are black was the same as the proportion of people who take GCSEs who are black or if it was the same as the proportion of people who get three As at A-level and are black:
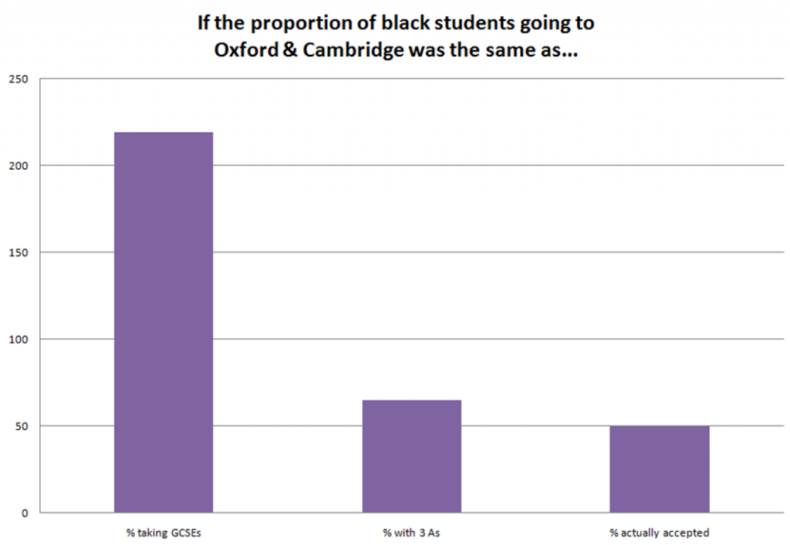
As you can see, the actual number of black students accepted to Oxford and Cambridge is – at 50 – lower than the number it would be if those universities were accepting the same proportion of black students as there are amongst those who get 3As at A-level.
That gap – between 50 and 65 – is, however, dwarfed by the much larger gap when you look instead at the proportion of people taking GCSEs who are black. If Oxbridge acceptances had the same proportion of blacks as GCSE exam sitters, there would be 219 acceptances each year, not 50.
The conclusion? Oxford and Cambridge are right to push back at politicians and point out how the under-performing of black students in the educational system pre-18 means they have a very lopsided pool of people to pick their students from.
But some of the more enthusiastic defenders of Oxbridge’s record do look rather complacent and unwilling to face up to their own responsibilities given that if the two universities were accepting the same proportion of blacks as there are amongst those who get 3 As, the would be take 30% more each year (65 rather than 50).
Note on sources: These figures are based on the standard census definition for “black”. GCSE figures are for England only; A level figures for the UK. Exam results and Cambridge entrance figures for the last three years. Oxford entrance figures for the last year. Thanks to both the universities for supplying me with the data.
Leave a Reply