When did the first tactical voting bar chart appear on a political leaflet?
When did the first bar chart, encouraging tactical voting, appear on a political leaflet in the UK?
Aside from the inherent interest in knowing this historical curiosity, it’s an interesting question to ask because of what it says about how narrow the methodological approach is of the contemporary British political science community. Huge numbers of academic papers and other writings about tactical voting have come out from it, often heavily reliant on opinion poll research and deploying statistical techniques to tease insights out of the polling and election results.
Those doing this are certainly aware of bar charts, and – at least when presenting their research in person – often joke about them too. But for all the work and erudition, ask them, ‘so when did the first bar chart appear?’ and none of them know.
It’s a striking example of how narrow their methodological focus is that the date of their appearance of the classic visual appeal is not only not talked about but not known. Modern British political science is – both for better and worse – usually aspiring to be statistically rigorous rather than historically rooted.
But when was the first bar chart?
I’ve been on the hunt before and the first example of a Liberal Party campaign guide mentioning bar charts (called ‘block graphs’) was 1984, with the publication including several recent examples from elections. Earlier than that I’d previously located a 1979 Richmond, London leaflet with bar chart. Its author however, David Williams, did not think this was the first ever but could not remember where the idea came from.
Thanks to the help of the kind team at the LSE Library, I’ve now managed to narrow down the date of creation further.
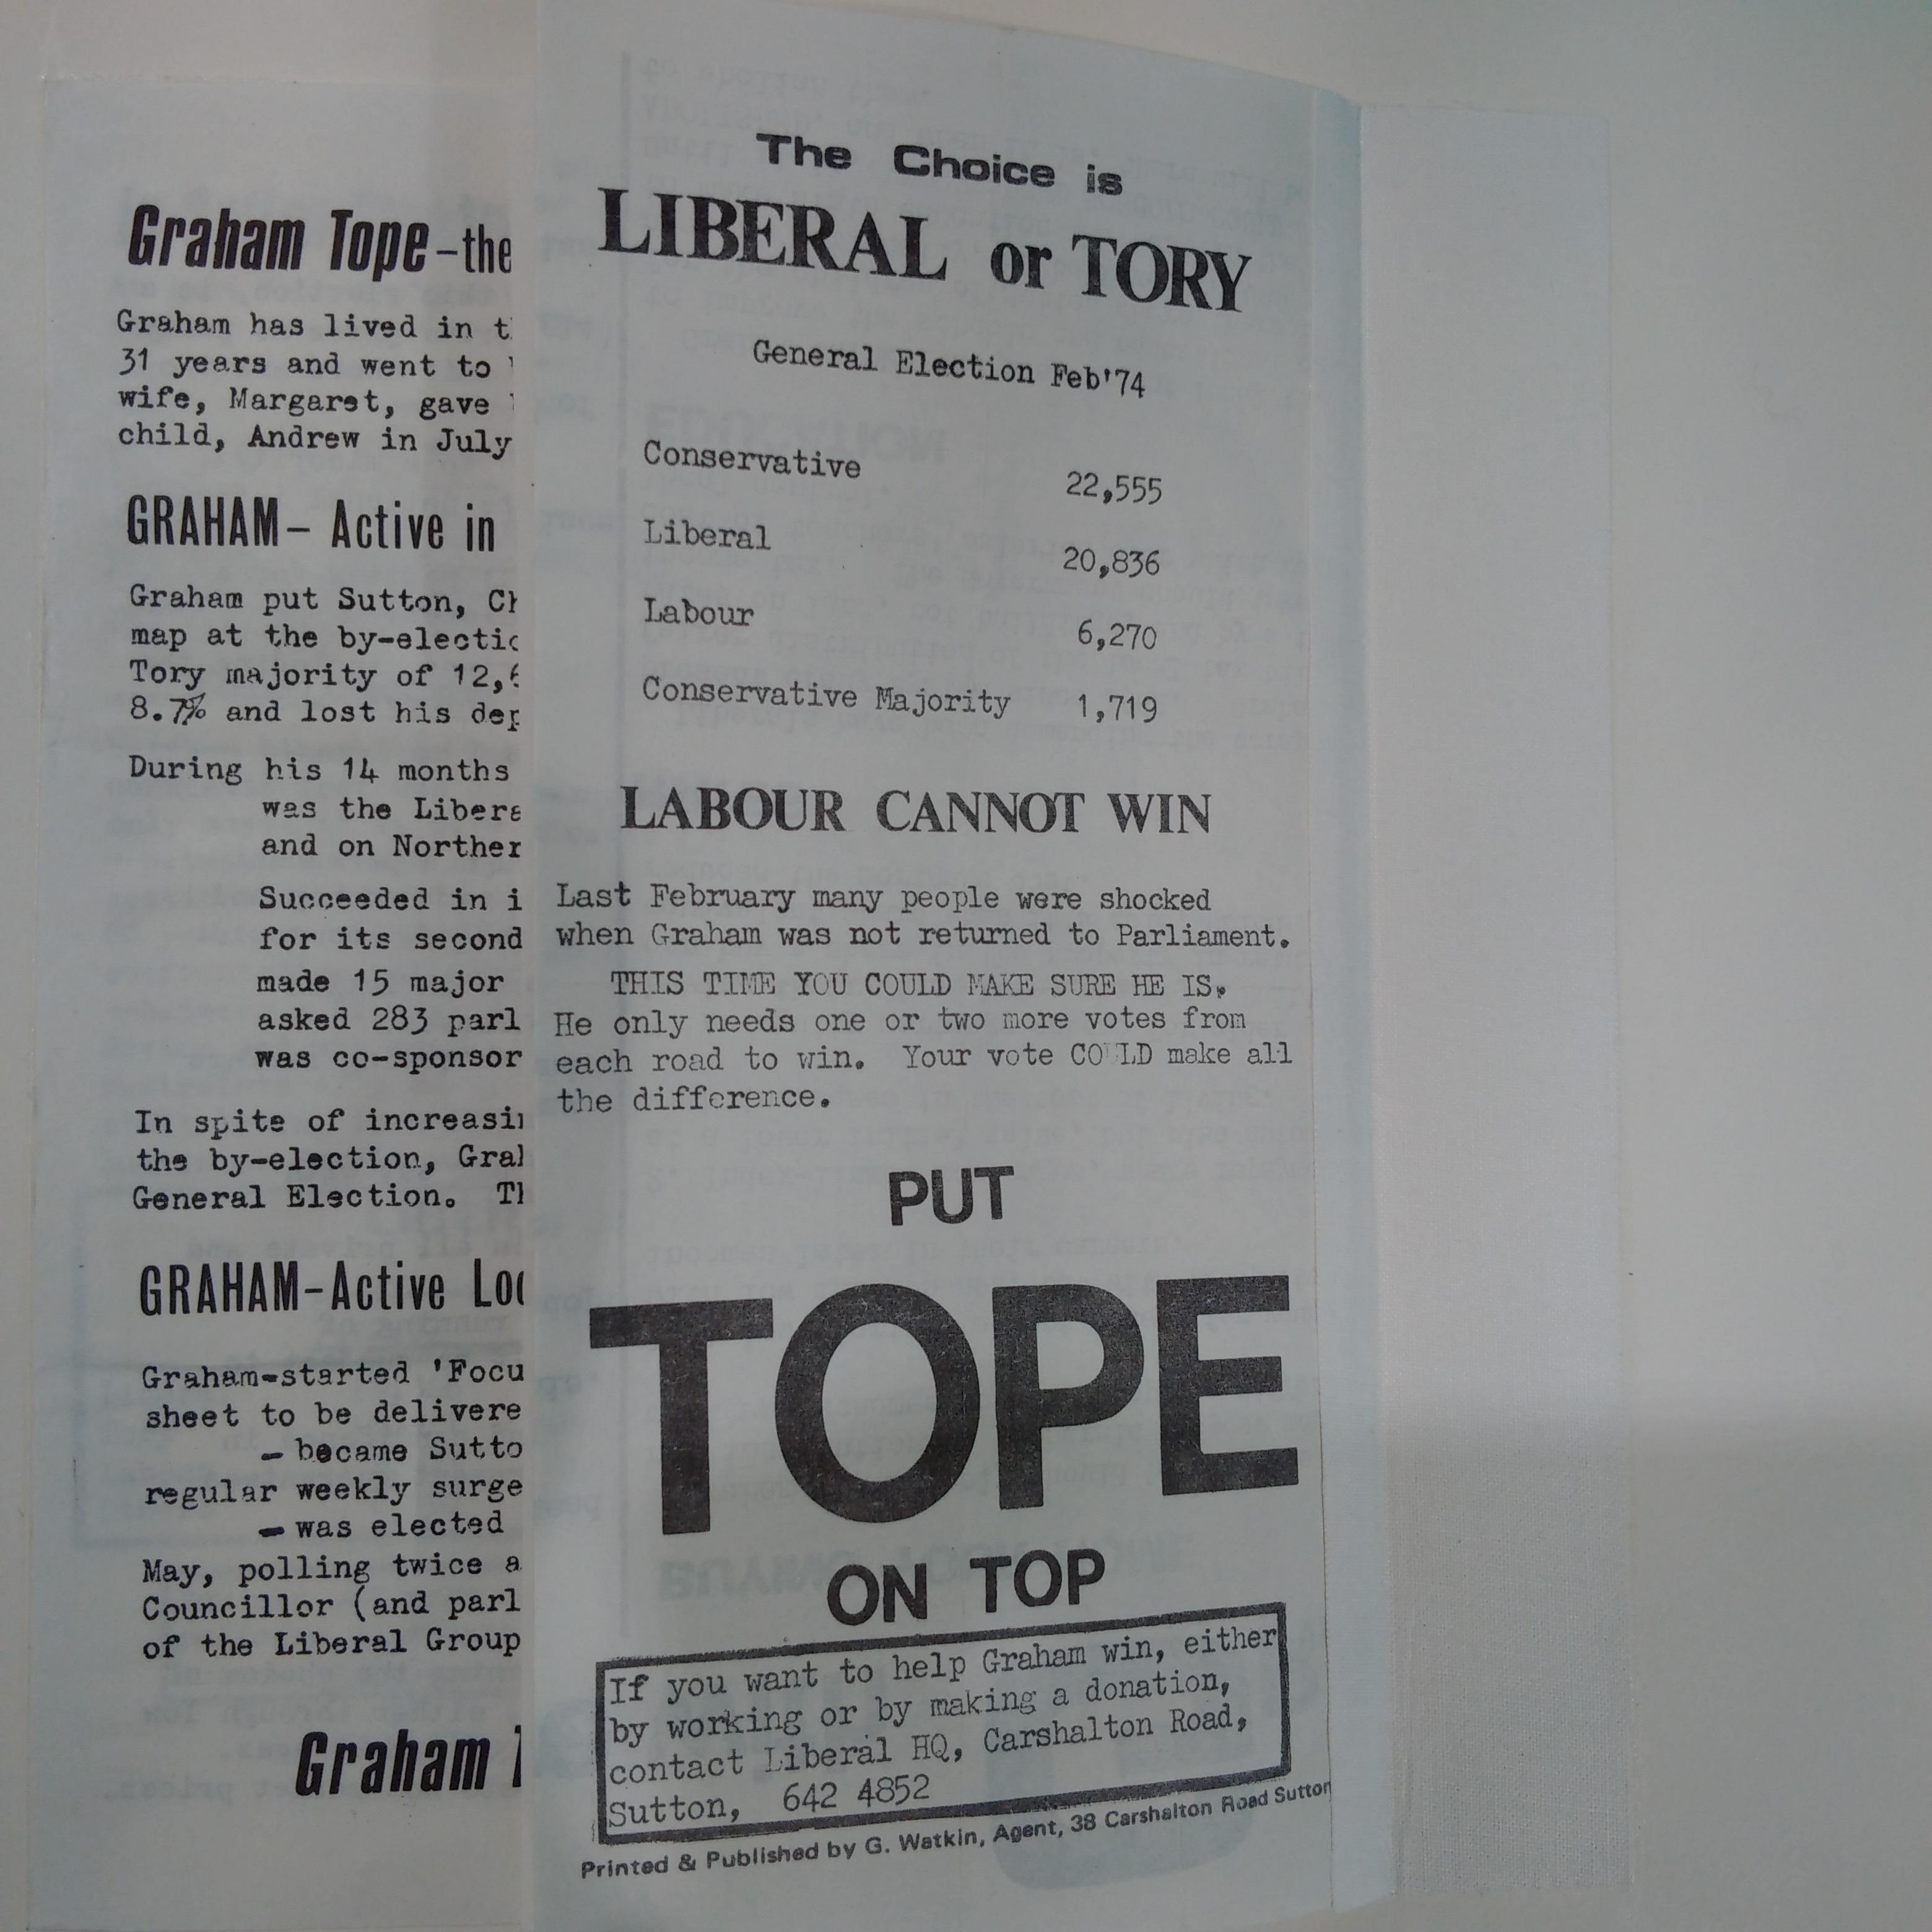
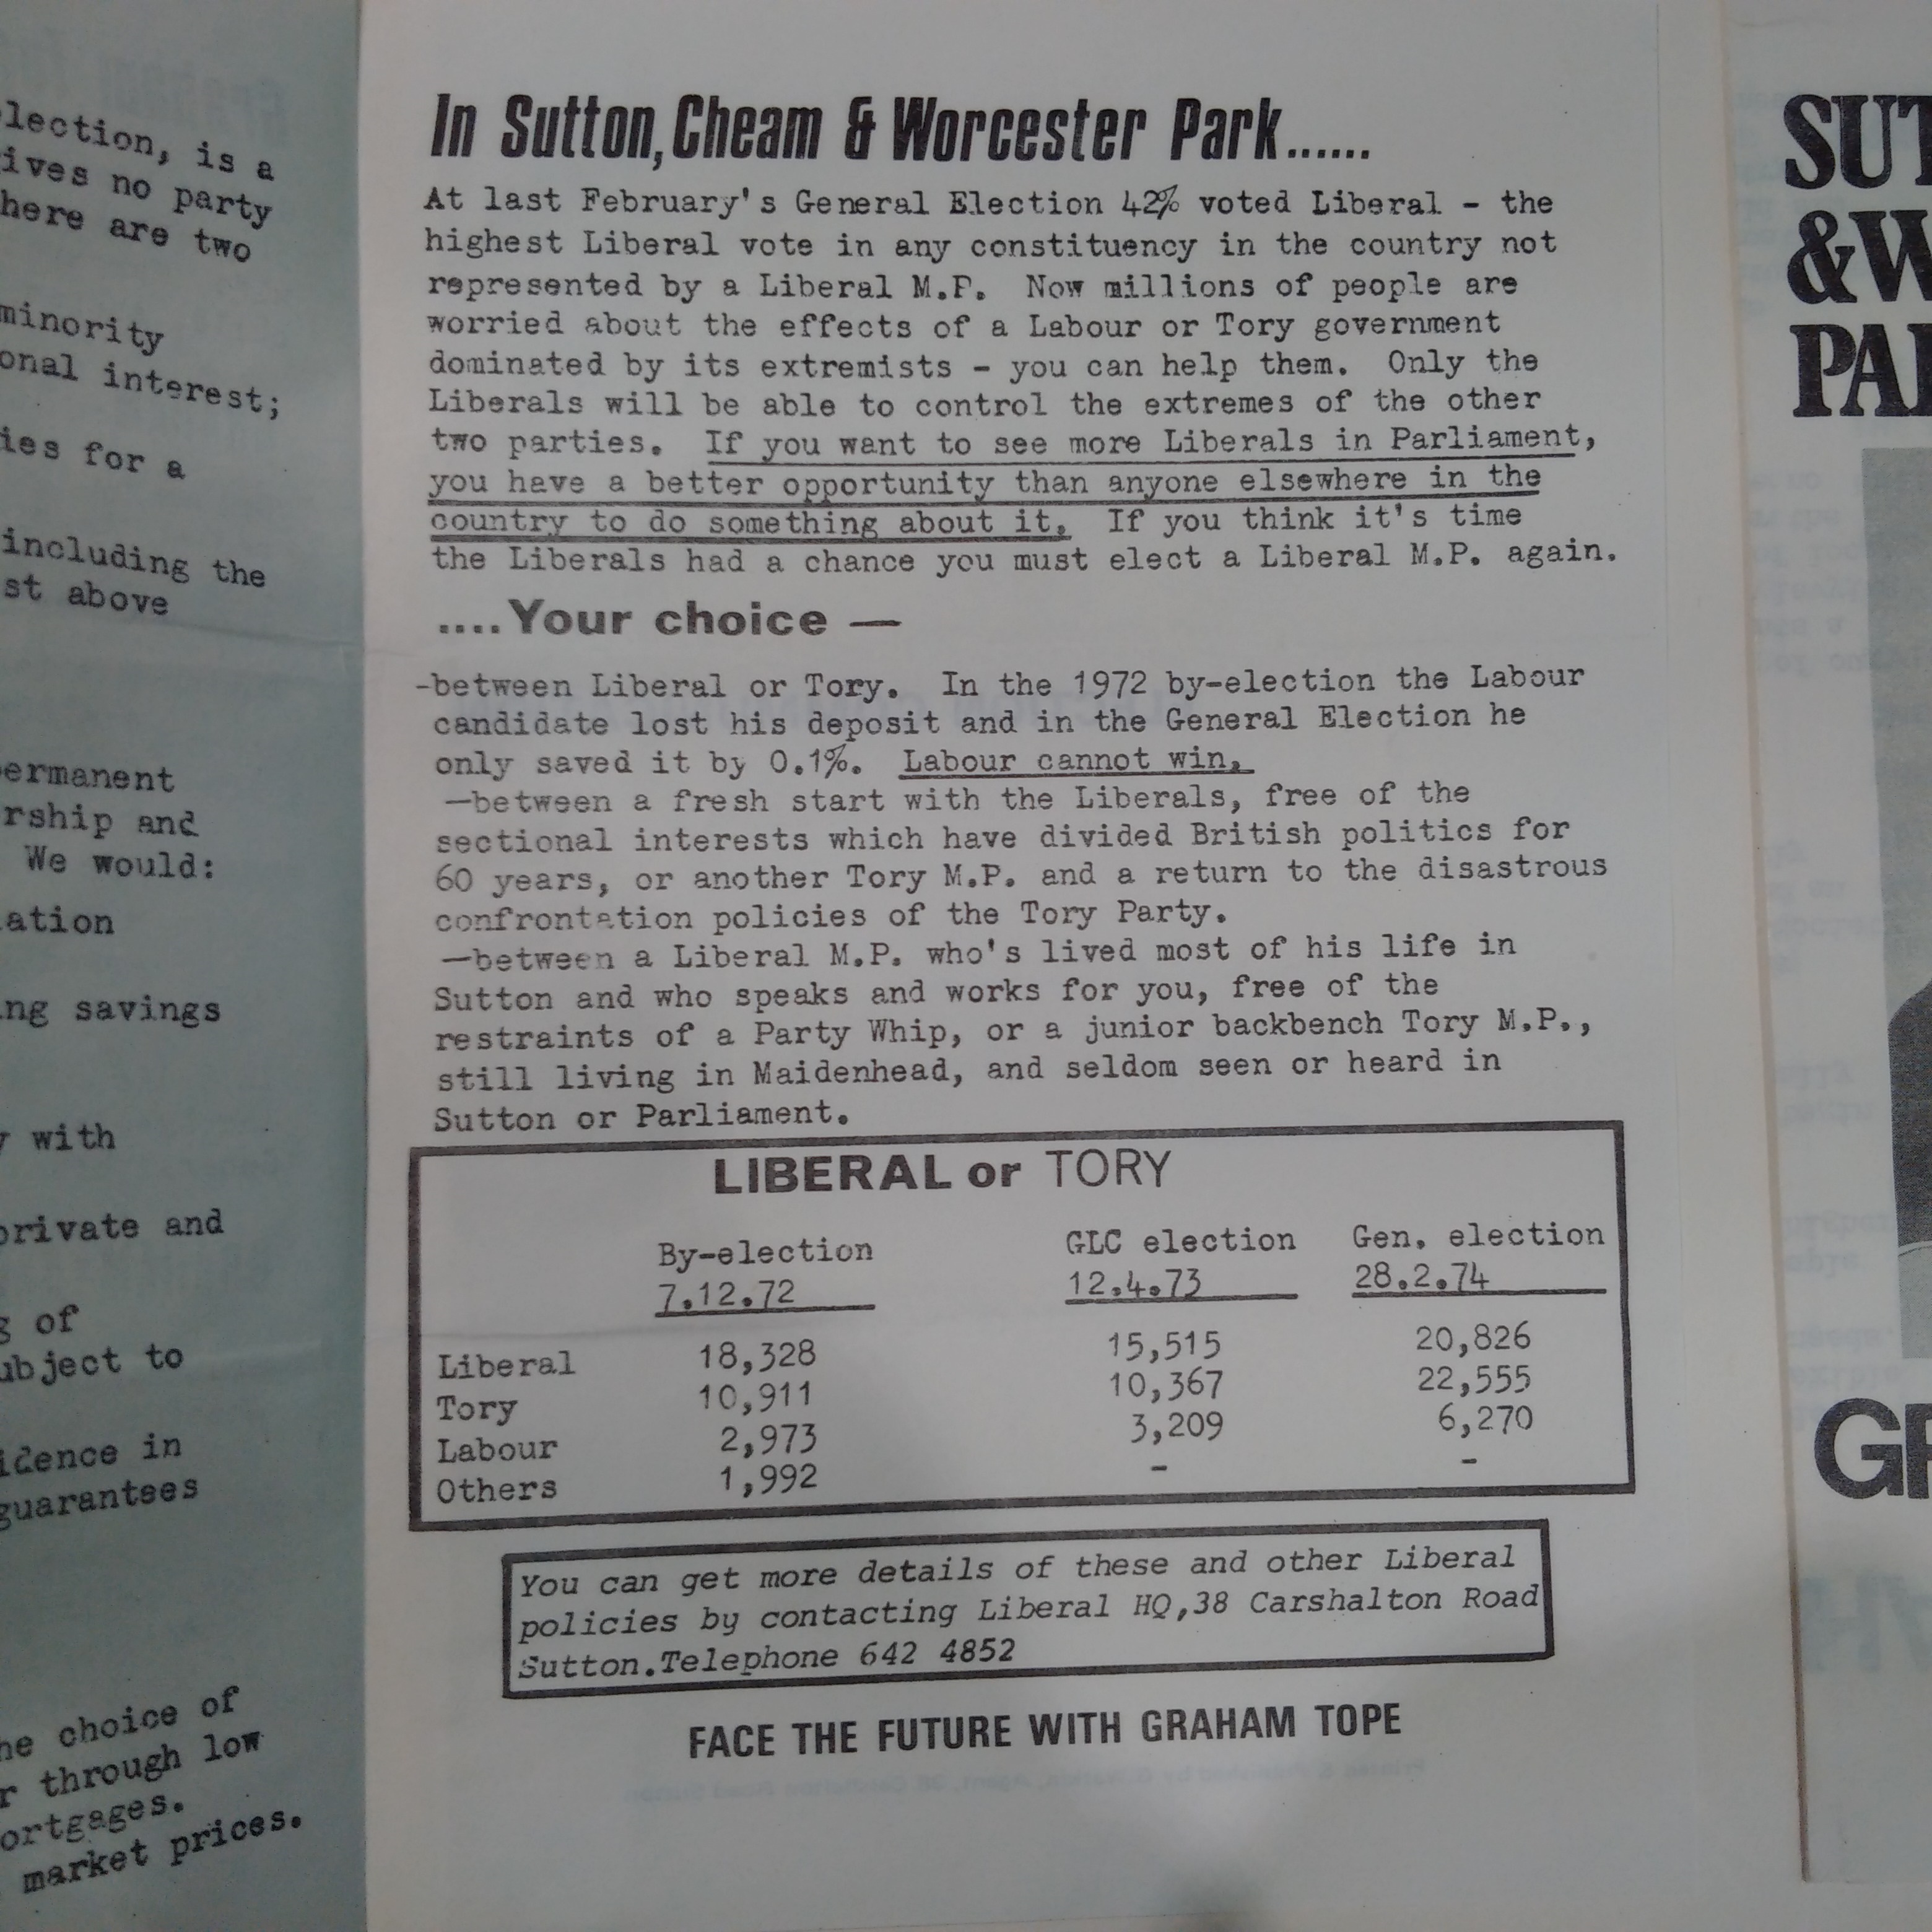
First, there is evidence from October 1974 that bar charts had not yet been invented because there are leaflets from that general election which have all the data, arguments and presentation that you would expect with a bar chart – except then use a table of numbers rather than a bar chart. Moreover, the examples come from places which were at the cutting edge of campaign tactics.
Here is an Adrian Slade leaflet from Richmond which illustrates the point:

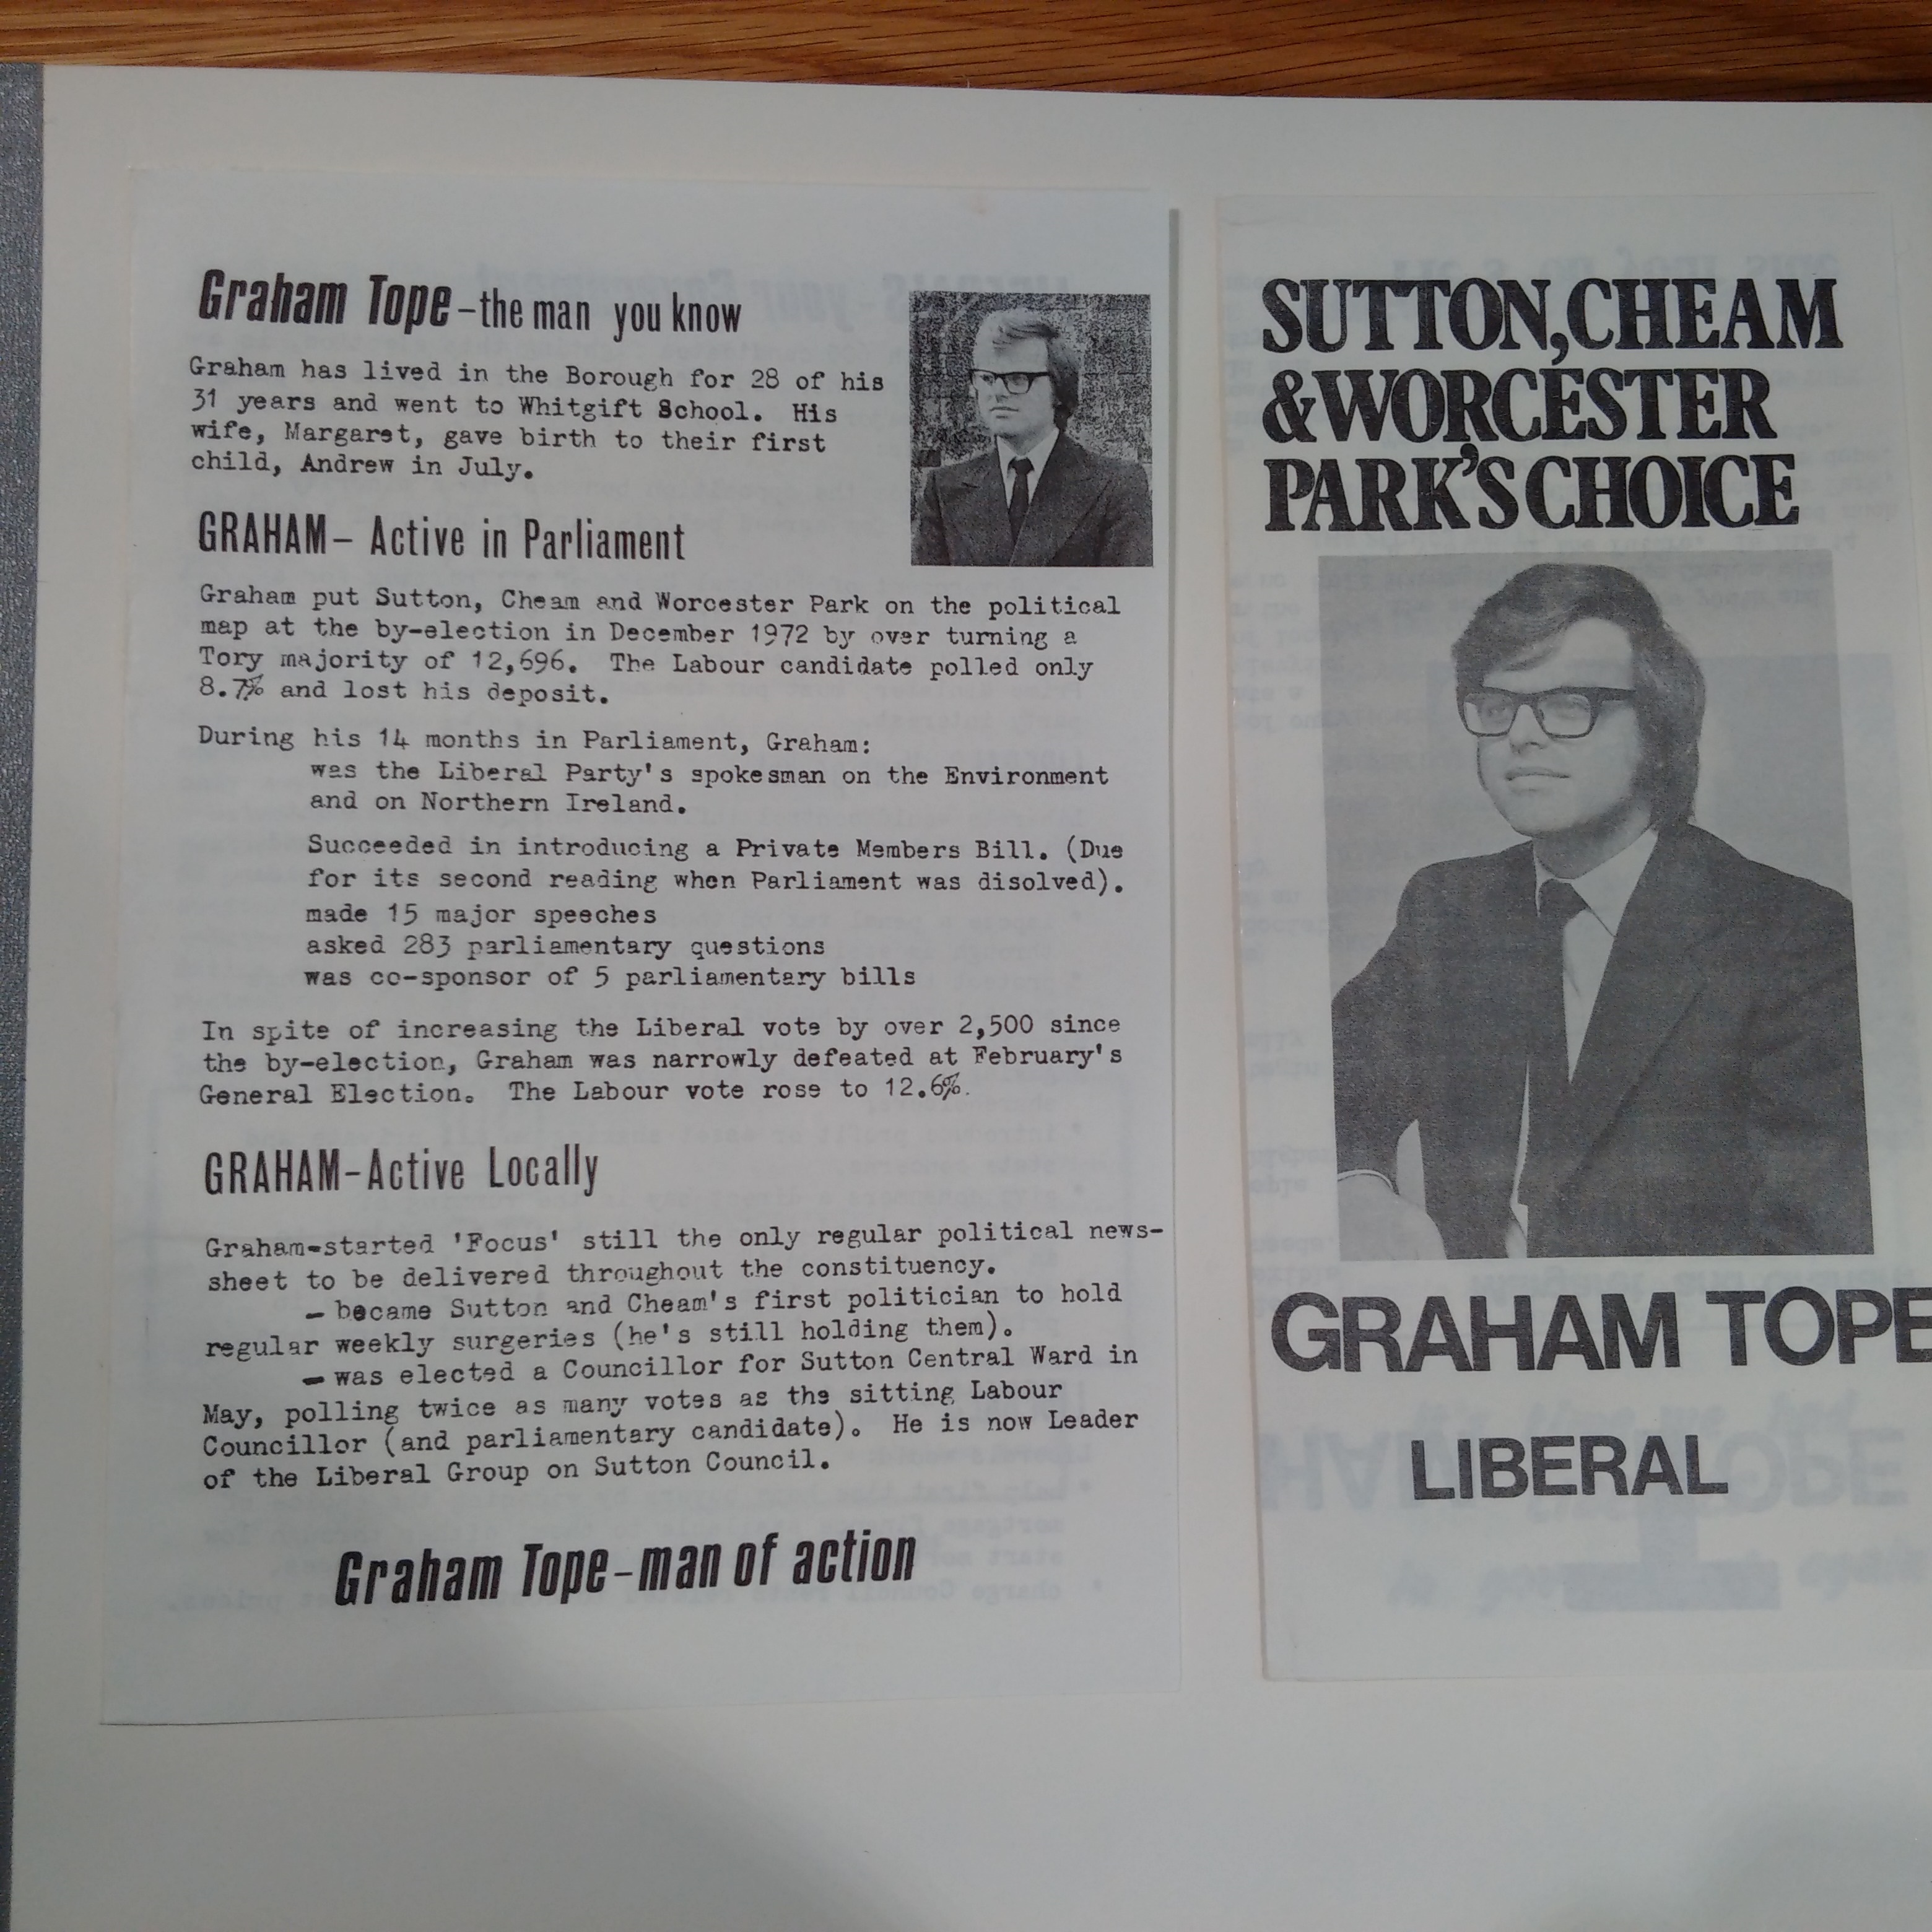
Likewise a Graham Tope leaflet from Sutton, one of the pioneering areas of Focus leaflets and local campaigning:
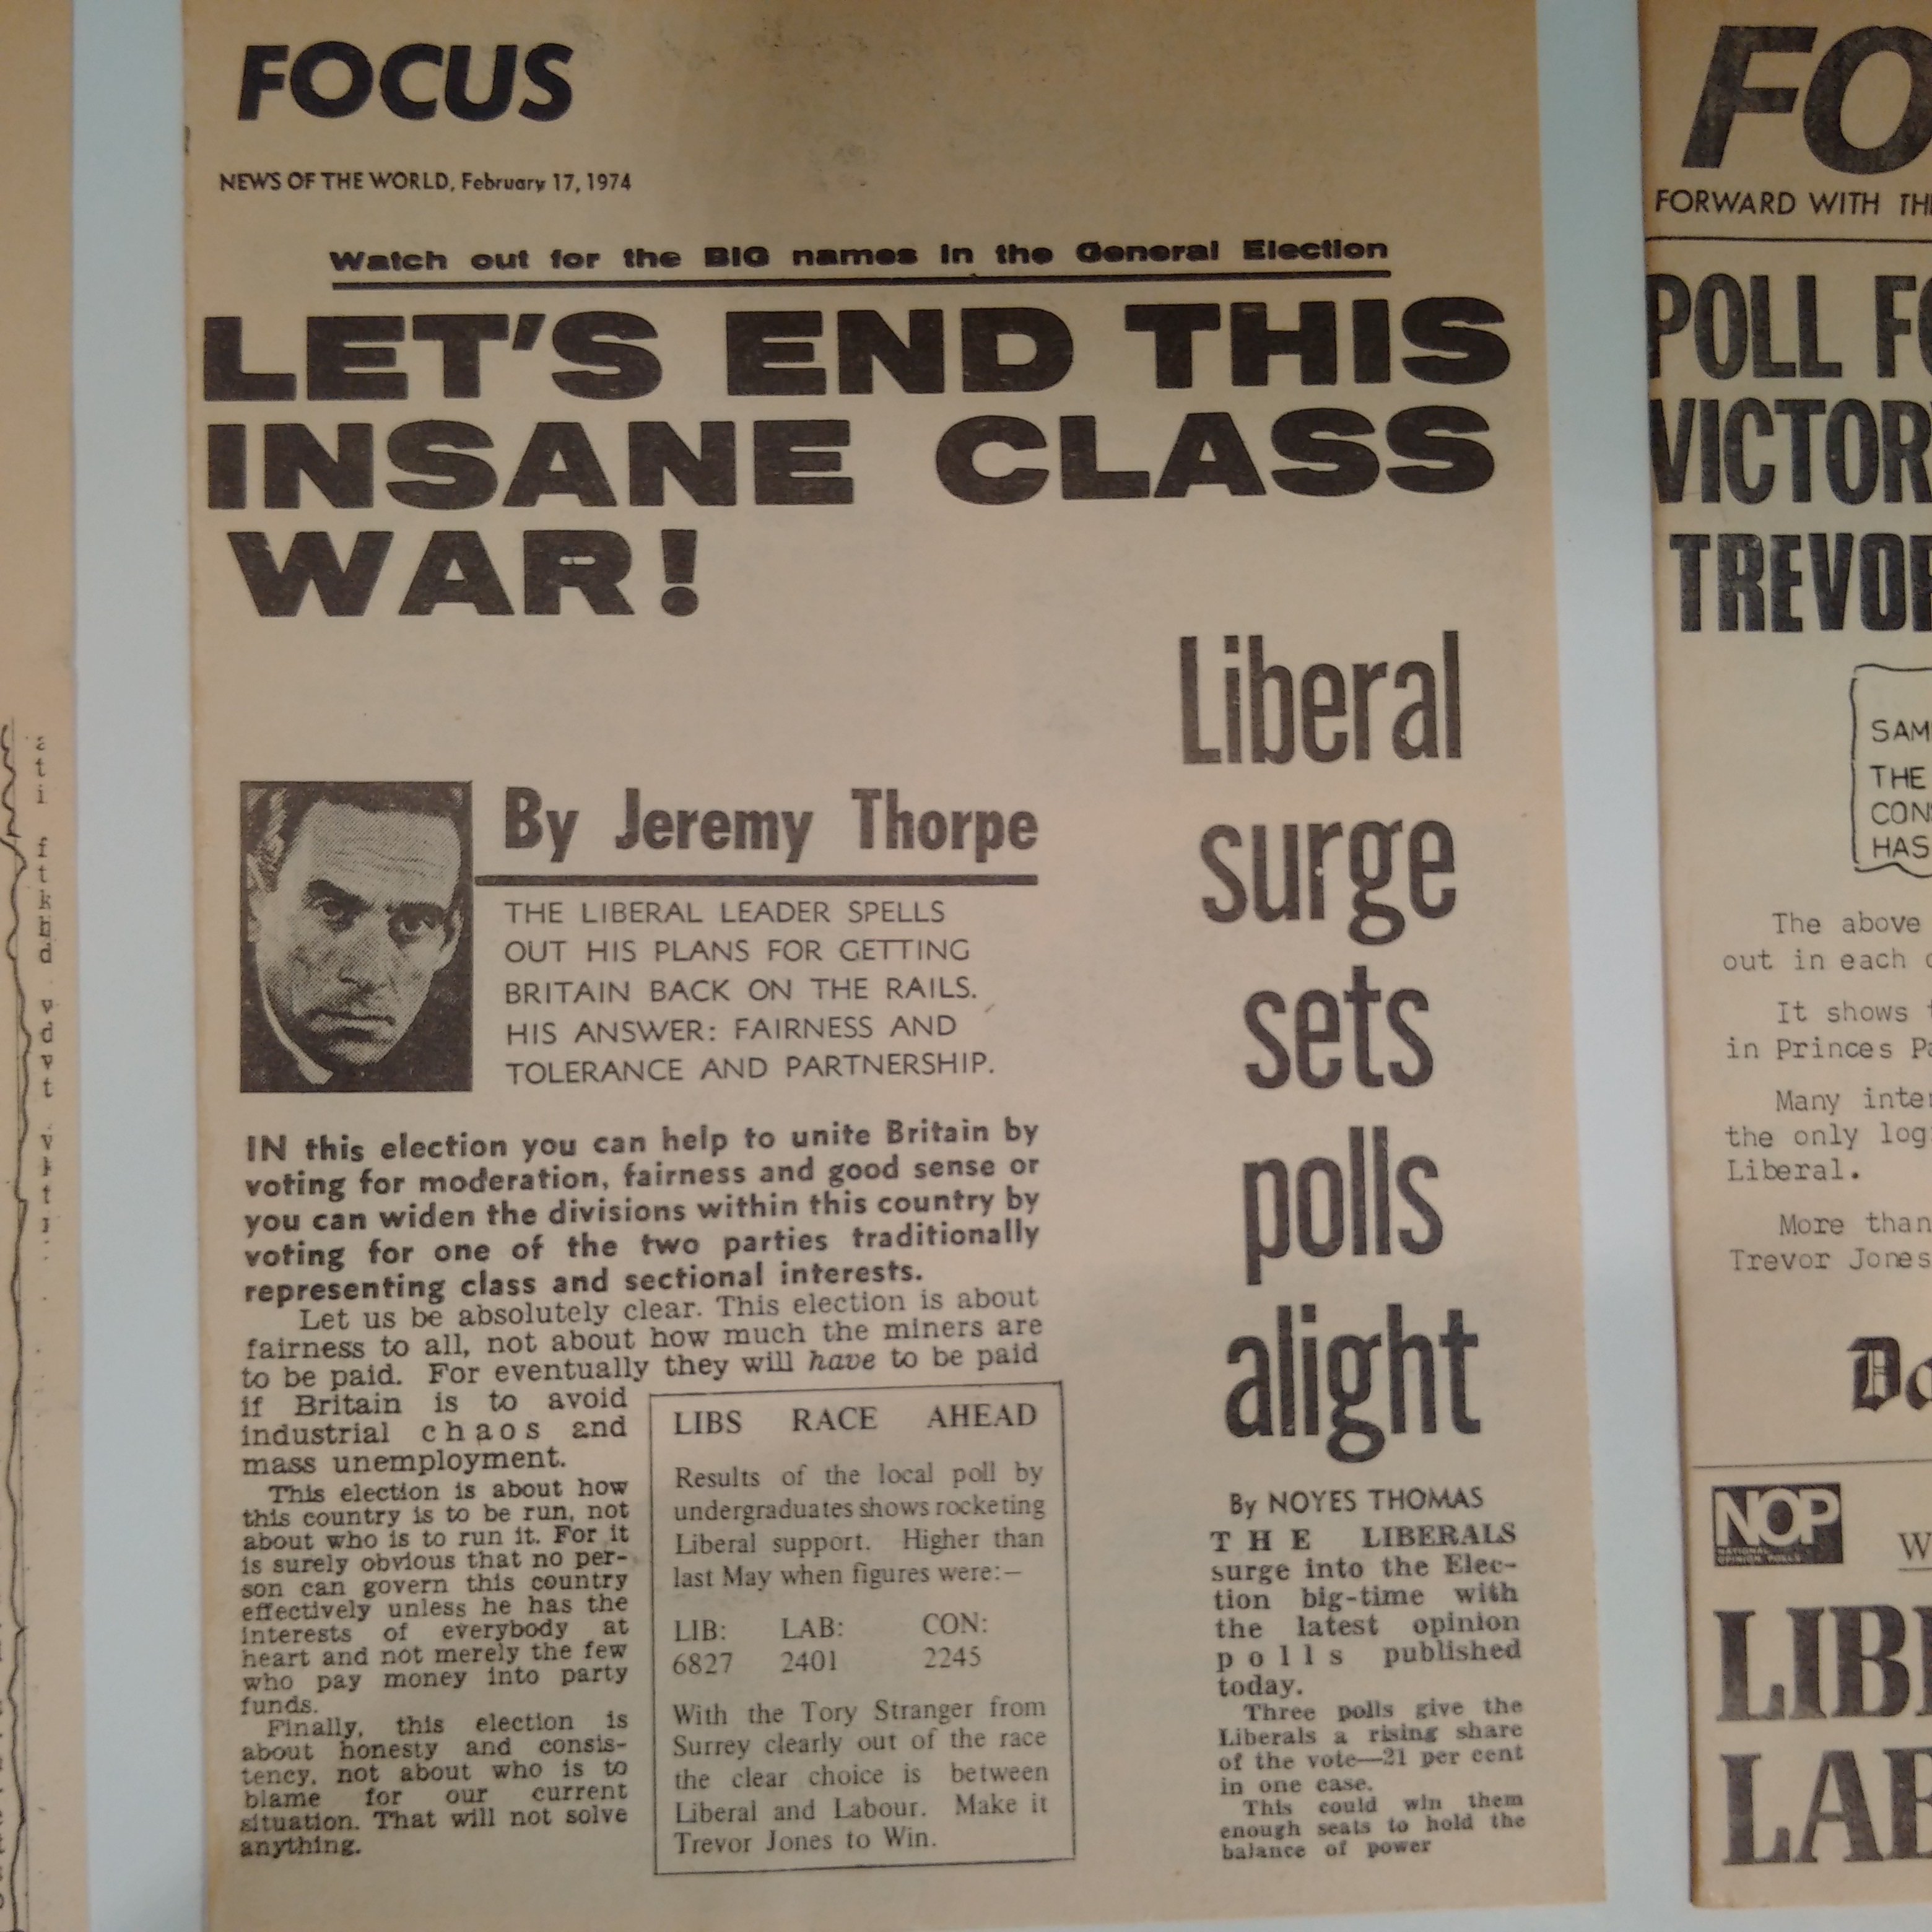
The story was the same in Liverpool, birthplace of many campaign tactics now considered normal across all political parties:

If tactical voting bar charts were around in that election, at least one of these leaflets would have had one.
Bar charts of a different sort were, however, starting to appear as this example from Tudor Gates in Bethnal Green shows:
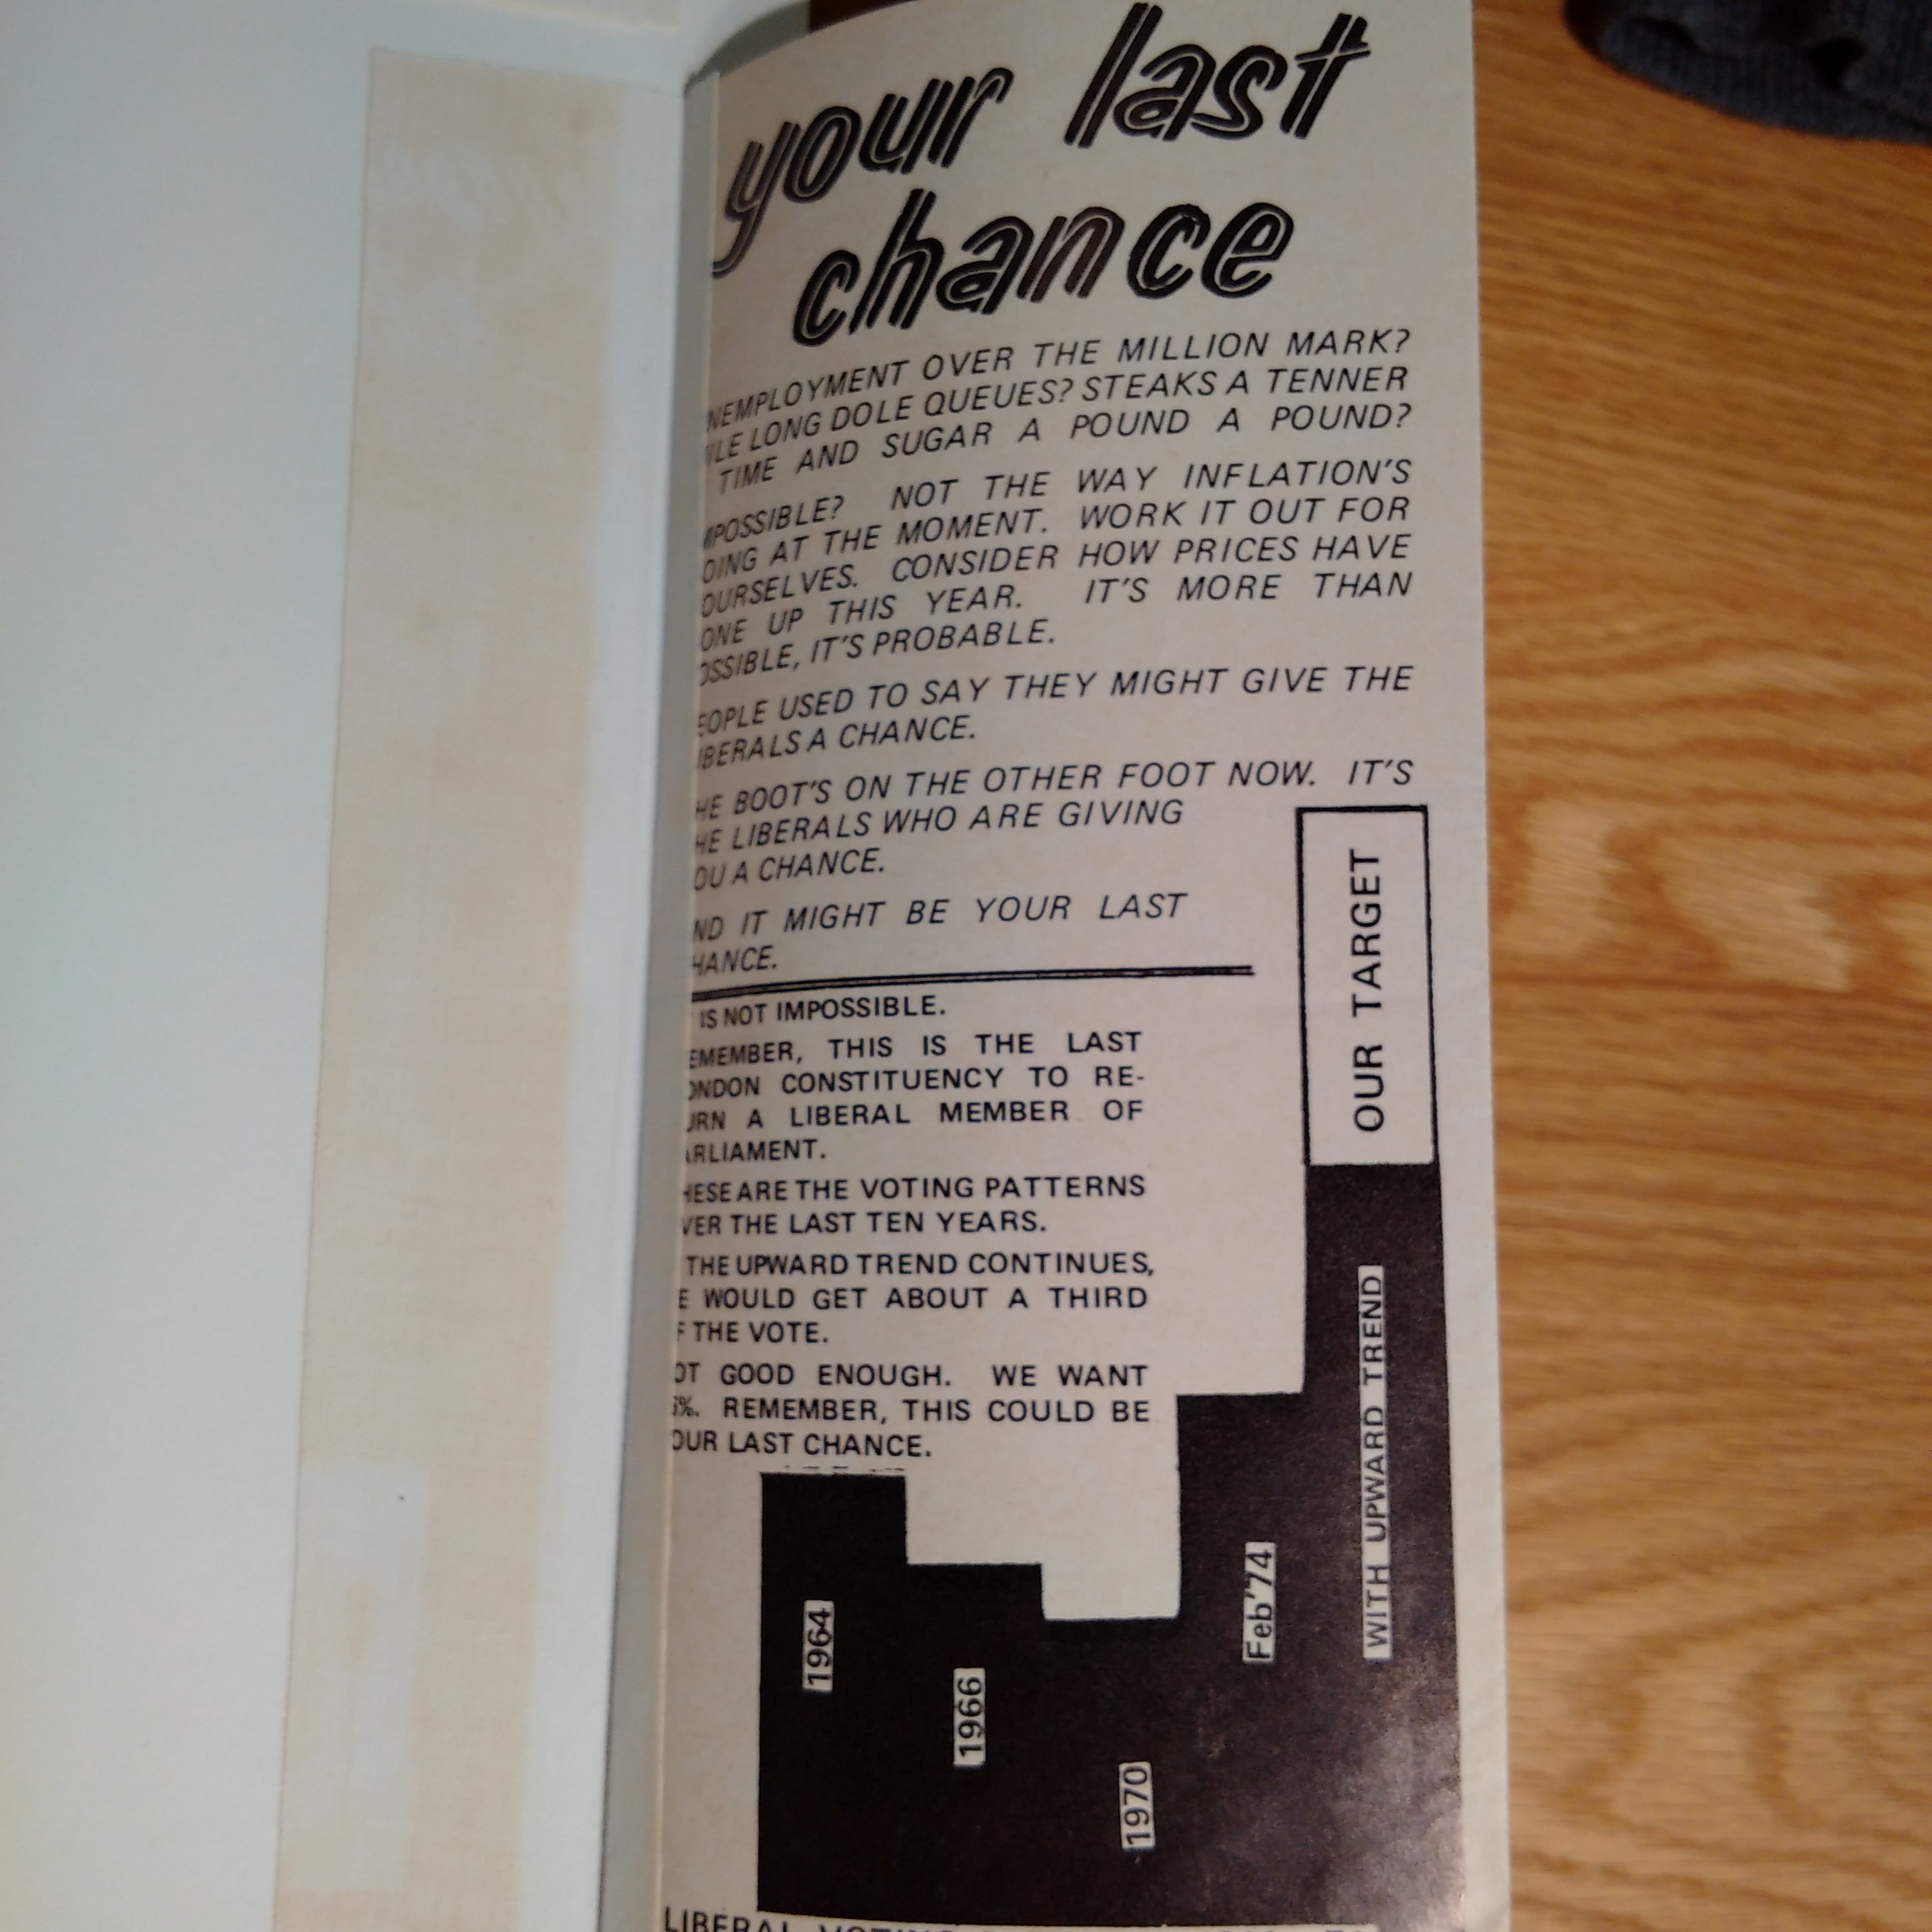
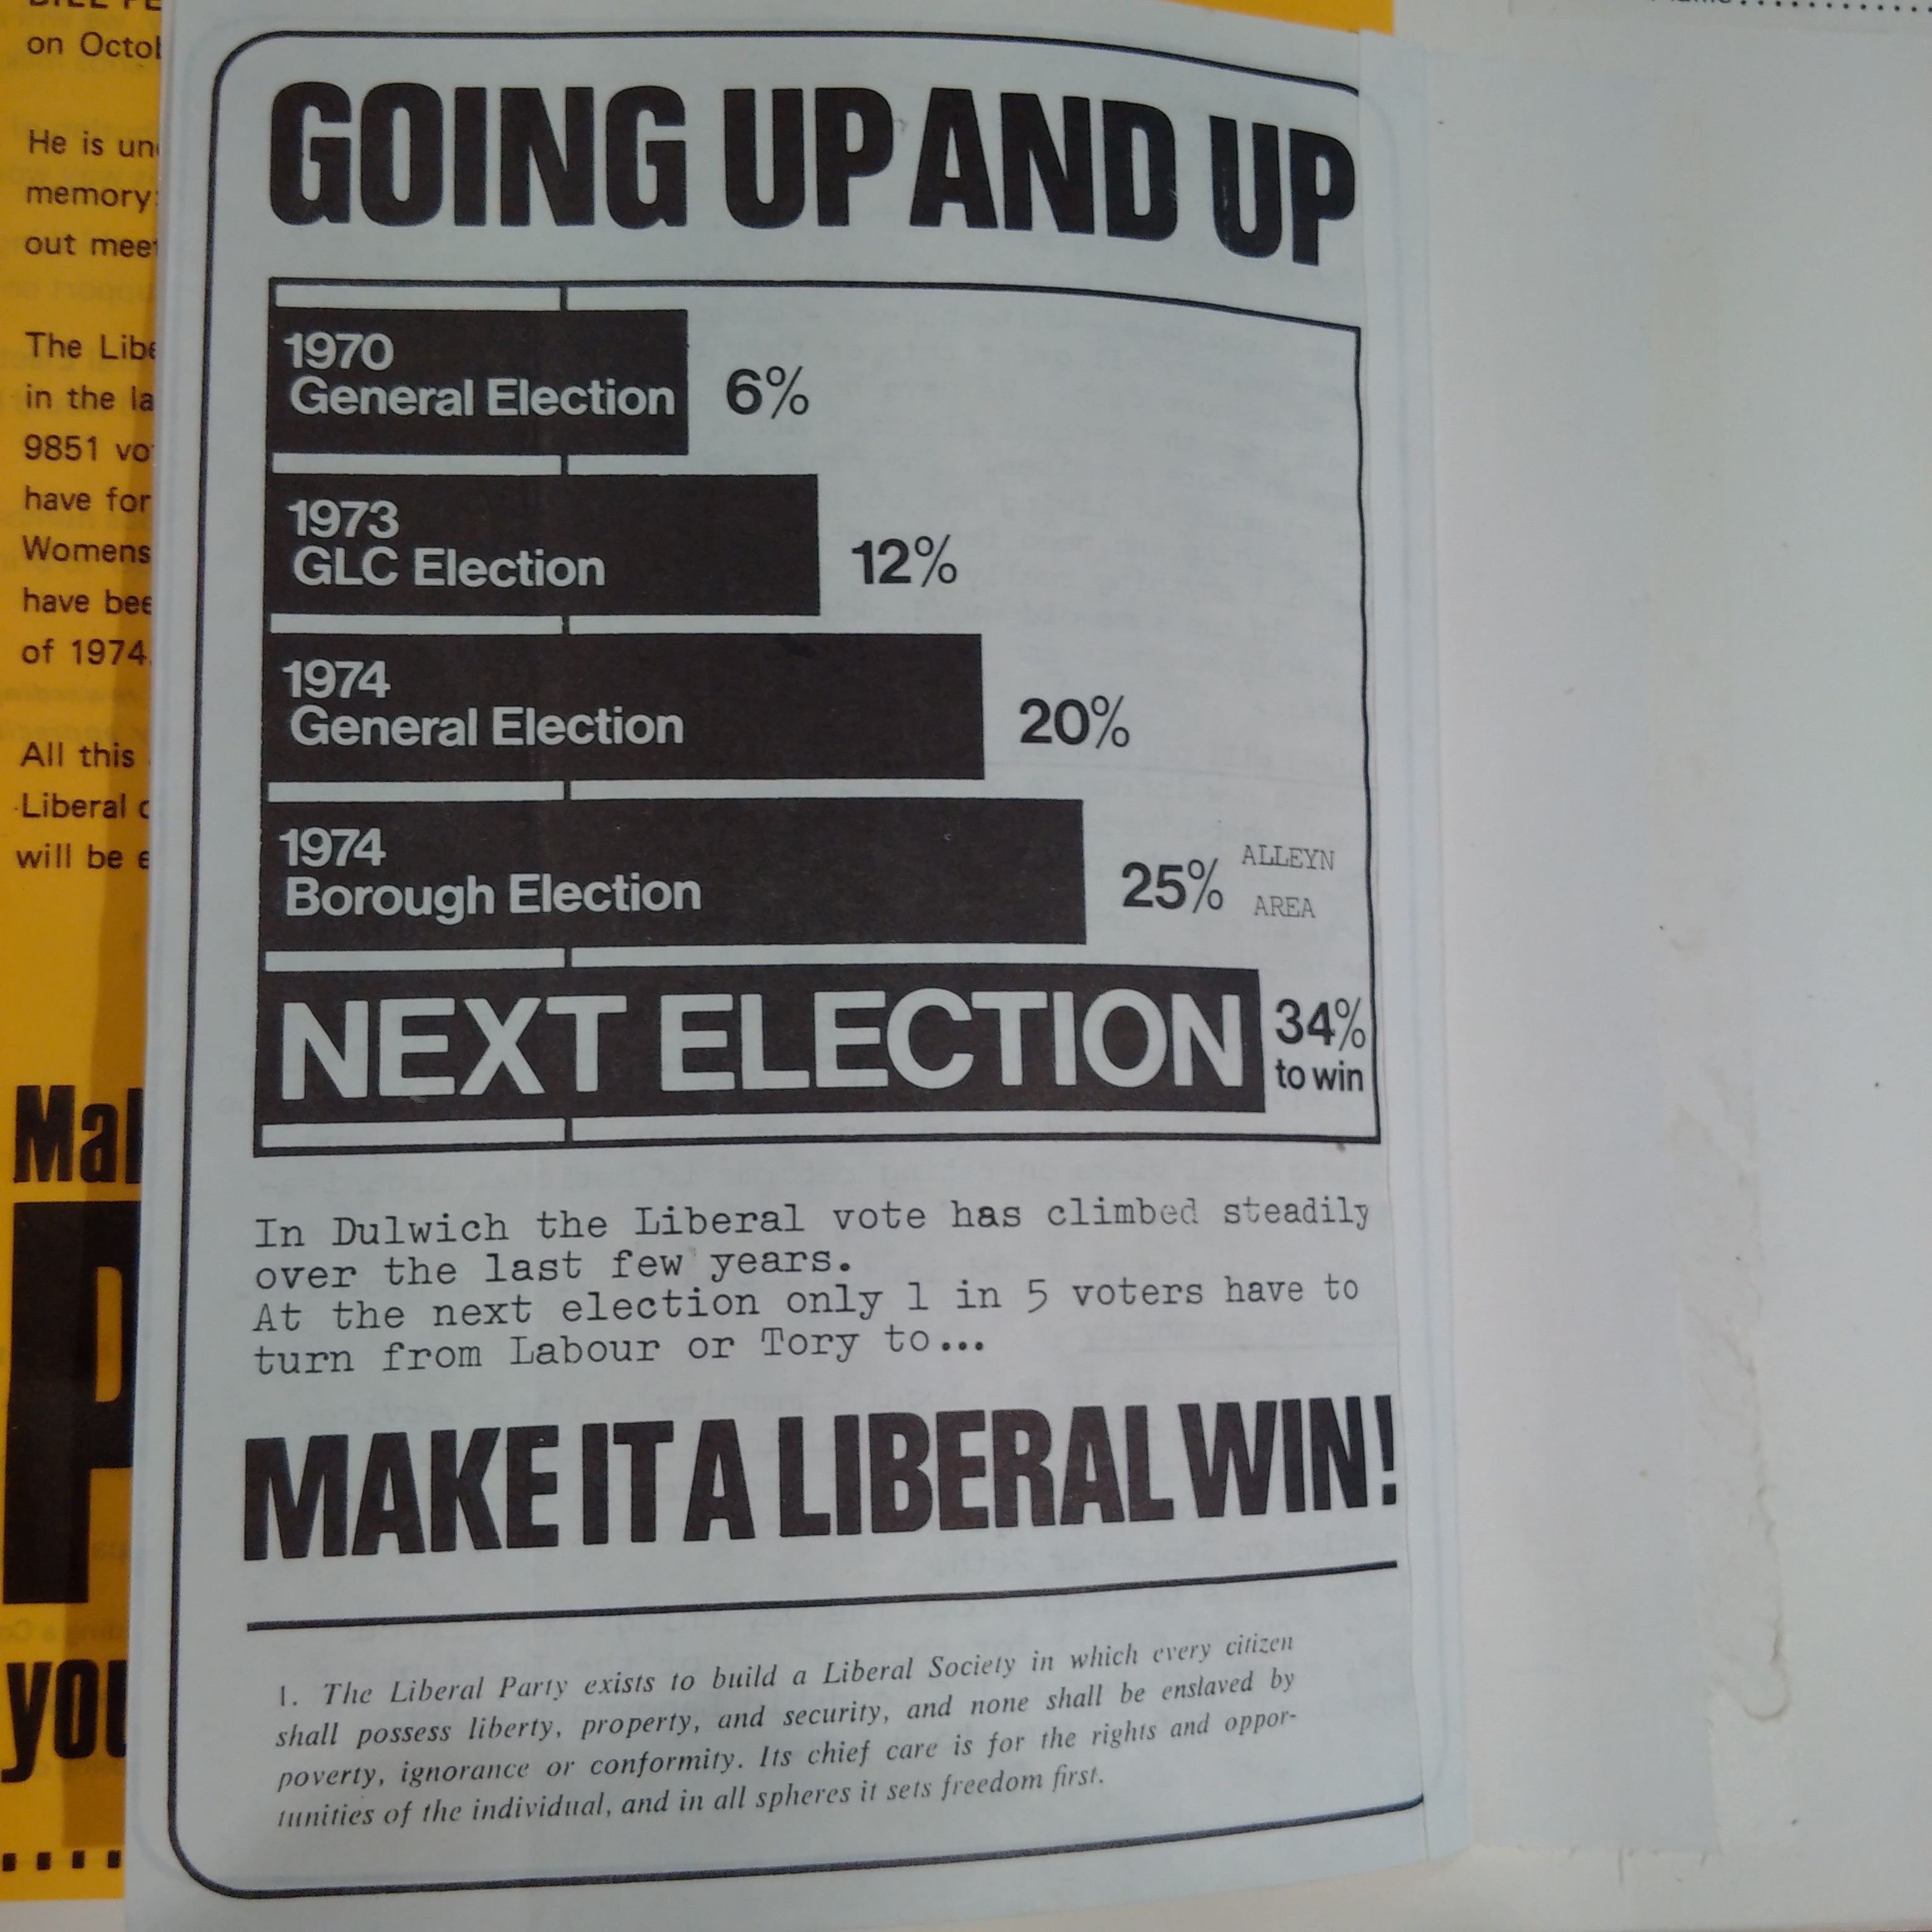
As does this one from Bill Pearson in Dulwich:
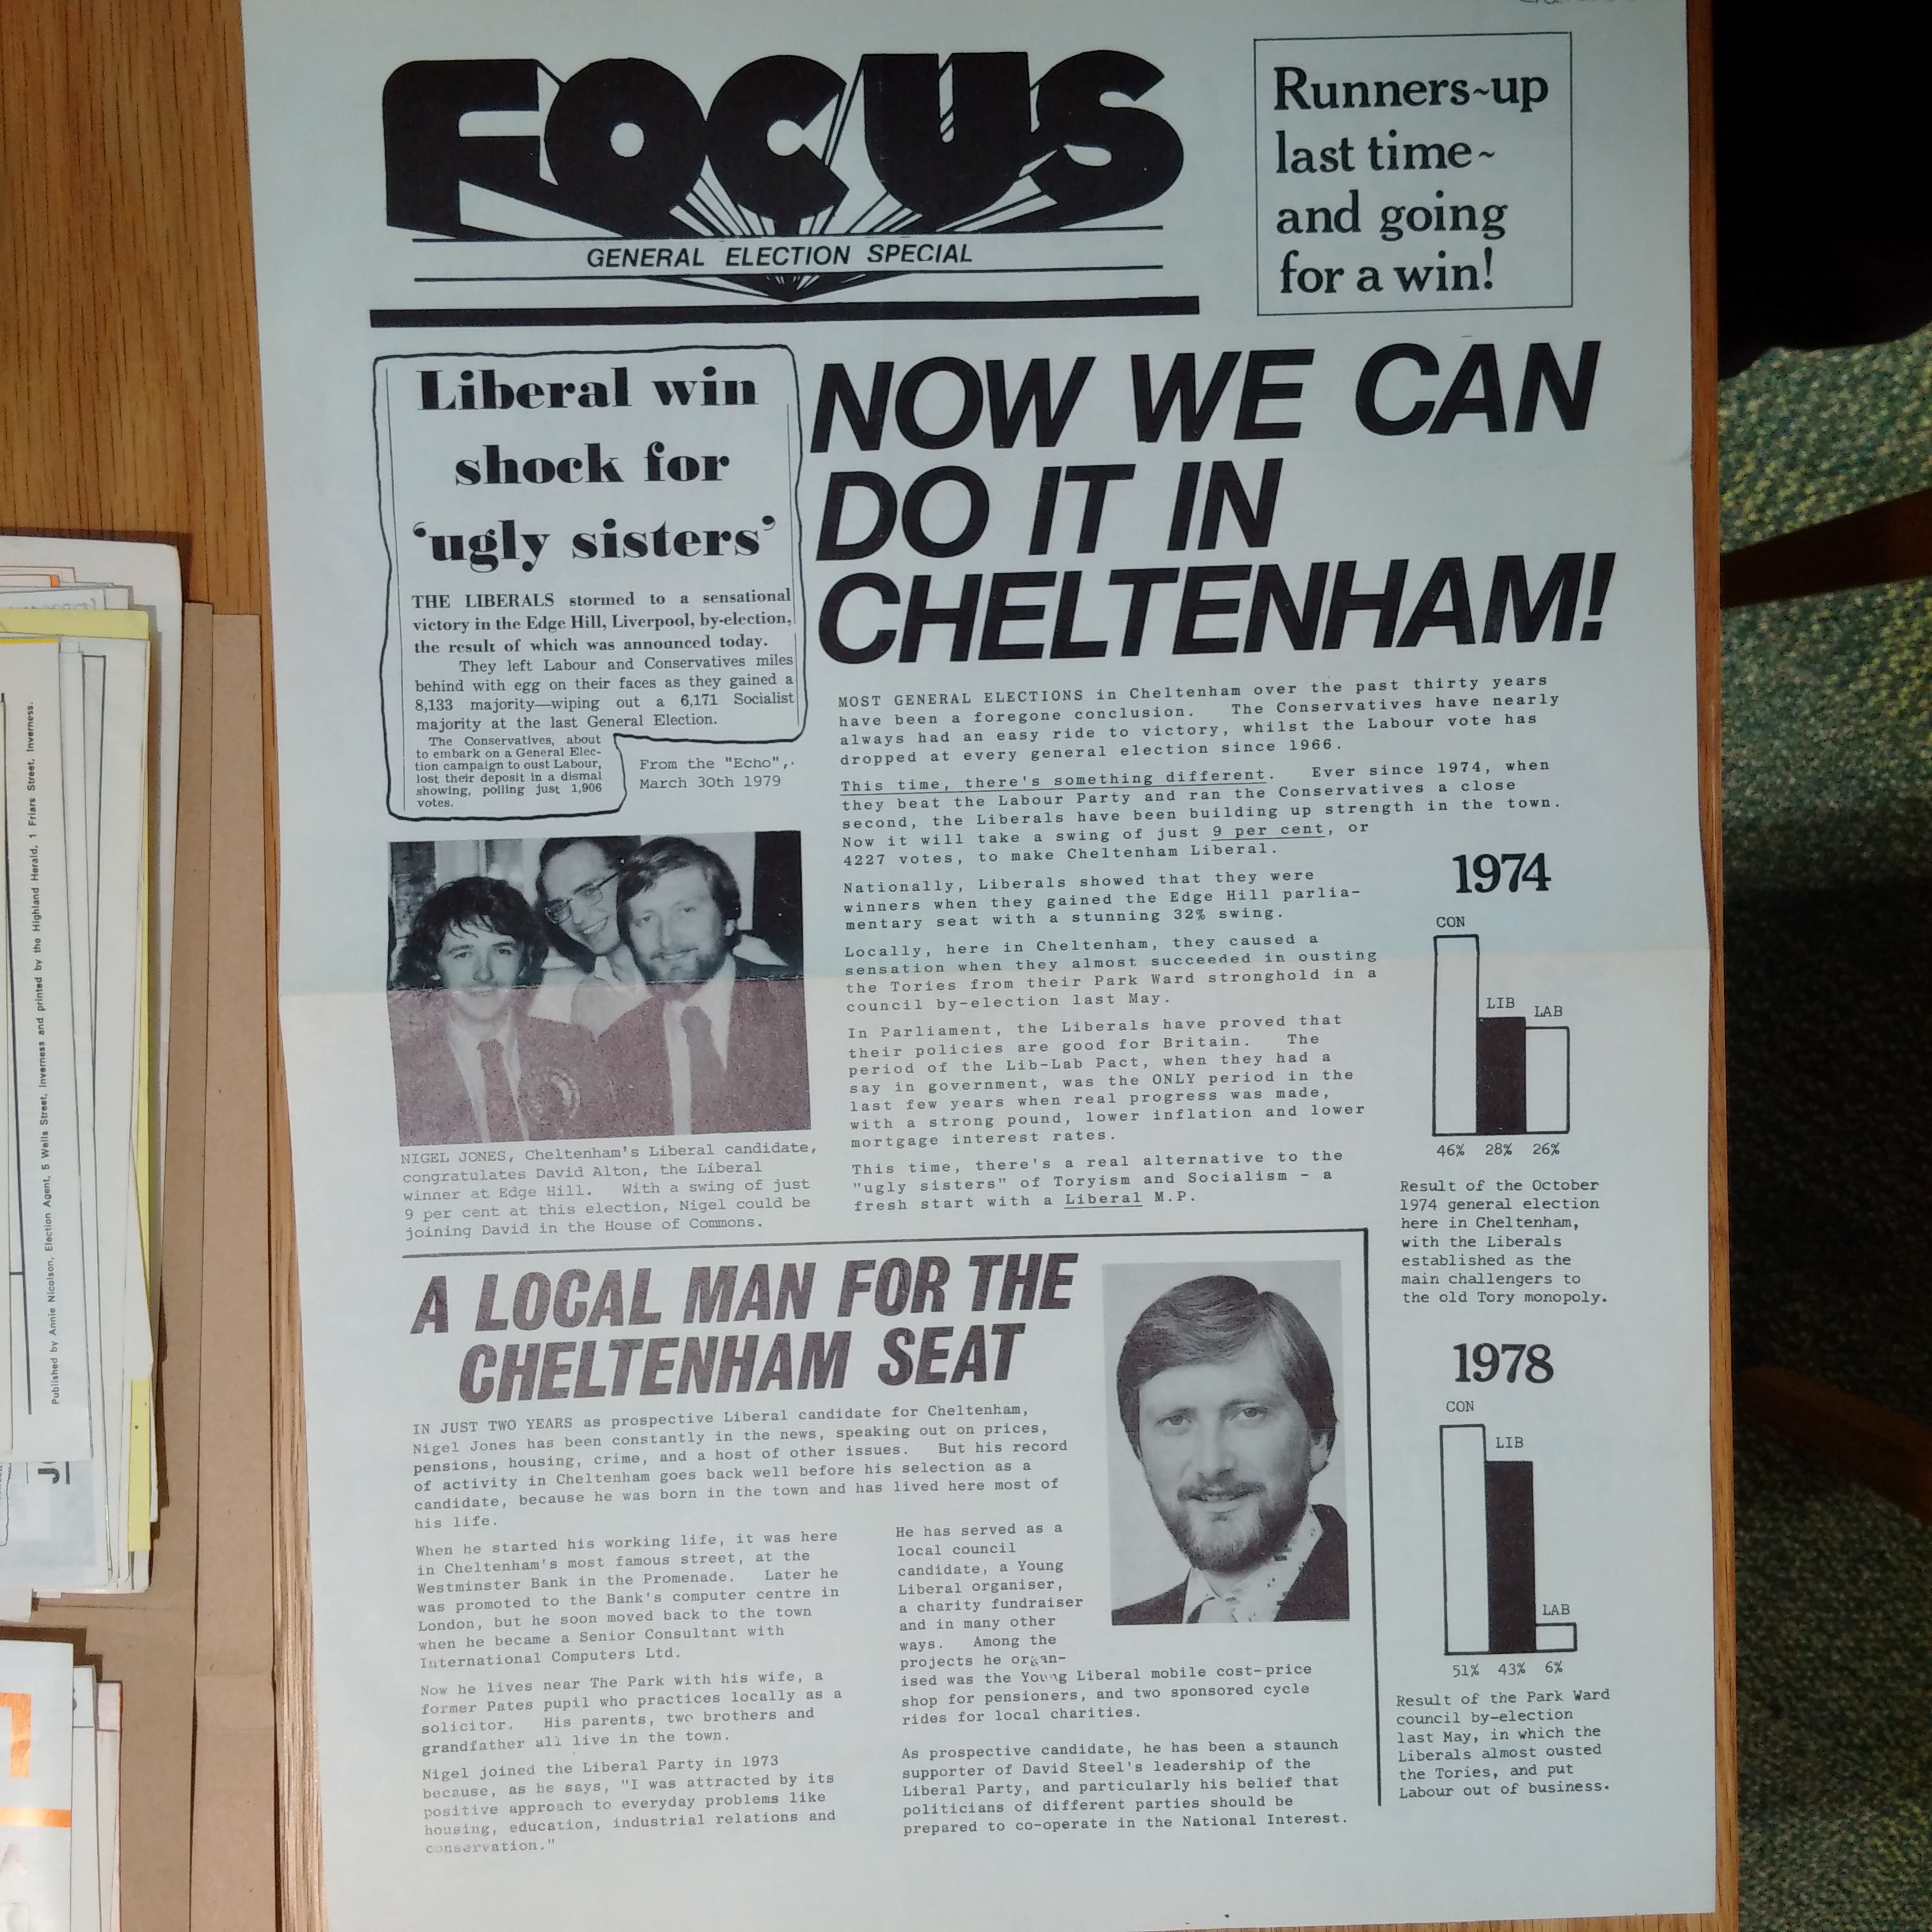
Only in the 1979 general election does the now traditional bar chart appear, not only in Richmond (see above) but also I found one from Cheltenham, suggesting that by 1979 the use of bar charts had spread around the Liberal Party:
So when did the first one appear? That’s still unknown, but the 1979 general election was the first to feature them and the origin was between October 1974 and the 1979 general election.
As to why bar charts matter, take a look at Bar charts: three things to remember about their power and for the broader campaigning context which made them so important, see my history of Liberal Democrat campaigning, The Liberal Democrat approach to campaigning: the history and debunking some myths.
UPDATE JULY 2022
Here’s an earlier bar chart, from a one-sided 1969 Conservative Party leaflet in Edinburgh:
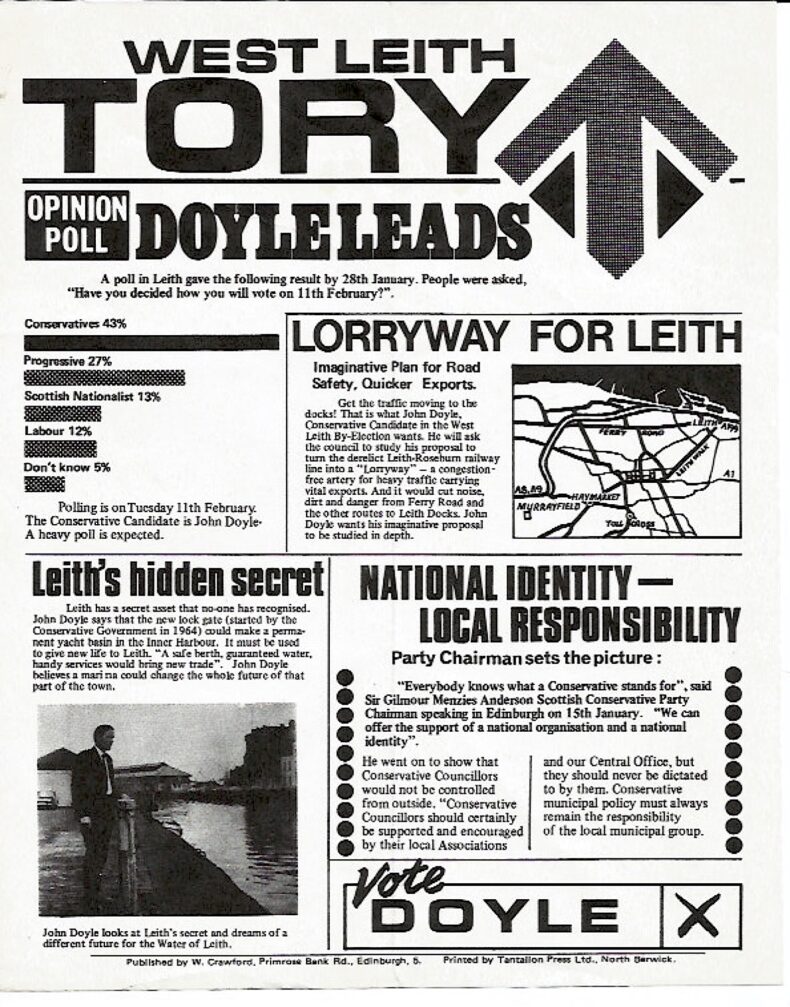
Arguably this is more a ‘look, we can win’ message rather than a tactical voting squeeze specifically. But it’s certainly a notable early bar chart appearance.
Thank you to Professor Barry Doyle, nephew of the candidate, for highlighting this leaflet.
That is indeed an interesting bar-chart, given that the ‘Progressives’ were just another form of Tories! Their name might have been ‘Progressive’ but they preferred to keep things as they had always been!