Bright spots of the 2010 election result: growth in number of winnable seats
The small overall net loss of seats in this month’s general election for the Liberal Democrats understandably rather overshadowed the growth in the party’s share of the popular vote, which was up for the third general election in a row.
The seat total was hit by the party not getting the lucky breaks in very close contests. The party won five of these knife-edge results but lost twelve.
That gives a hint as to what was happening overall to the number of seats won or close to won. If you total up the number of seats the party has won or come within 10% of winning over the last five general elections, you can see there is a consistent and significant long term growth:
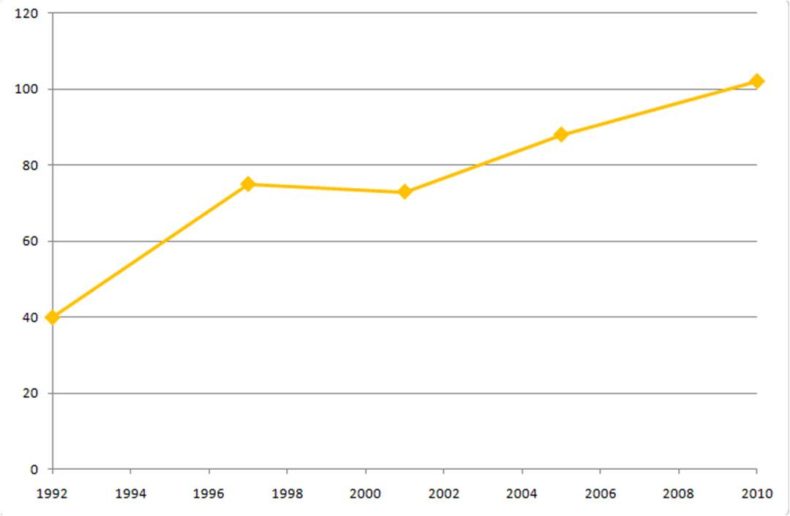
Voting reform for the Commons may make this trend partially redundant, though going into an election under AV against a backdrop of steadily increase the number of strong constituencies would be much better than if our base had been shrinking over the years. The trend also illustrates how the party has managed to successfully combine heavily concentrating efforts in key seats with also growing the number of key seats over time.
Overall the number of second places also grew, as Mark Thompson has pointed out.
A footnote: the list of seats where the party was within X% of winning has never been, and I very much doubt ever will be, the same as the party’s actual list of target seats. I have no complaints about people think the two are the same because that helps make for some very nice constituency odds each time which keep my bank manager happy… The overall numbers do however give a sense of how the field is shifting.
Leave a Reply