Proportion of voters saying they’ll vote tactically rises (probably)
Apologies for being a little late with this polling news, but polling carried out by BMG for the Electoral Reform Society last month is still rather relevant:
The polling found that nearly a quarter (24%) of voters’ plan to use their vote tactically – turning to a party or candidate to keep out someone they dislike more. Based on 2017 general election turnout, this would equate to almost 7.8 million votes. Around two thirds (66%) say they’ll vote for their first preference regardless of how likely they are to win, and 10% say they don’t know.
When the same question was asked before the 2017 general election, 20% of people said they’d opt for someone who wasn’t their first choice.
The exact level of tactical voting support in such polls can be sensitive to how the proposition is asked, which is a reason to keep an eye on the trend in particular between comparable polls.
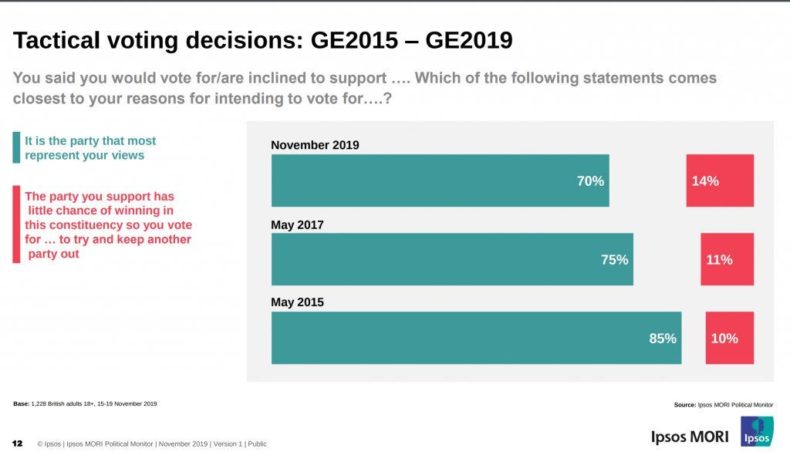
Ipsos MORI has also found an upward trend:
Another recent poll, but alas without a comparable one from before to compare with, was by ICM for Make Votes Matter:
Excluding those who are not eligible to vote and those who are certain not to vote, over a third of people say that they are likely to vote tactically in the upcoming general election on December 12 (35%). Over half say that they are not likely to do so (53%), while one in eight don’t know (12%).
By contrast, Deltapoll found only 9% answering the question, “Which one of the following reasons comes closest to the main reason you will vote for the party you chose?” with “I really prefer another party but it has no chance of winning in this constituency”.
However, an even higher tactical voting figure comes in the latest ComRes poll:
I would be prepared to vote tactically, for a candidate or party I did not support, in order to prevent another party from winning in my constituency:
Strongly agree – 17%
Somewhat agree – 26%
Total agree – 43%Somewhat disagree – 11%
Strongly disagree – 20%
Total disagree – 31%Neither – 11%
Don’t know – 14%
All this helps explain why bar charts are featuring so much in this election.
Leave a Reply