Do Parliamentary by-election results foretell general election results?
Whenever there is a big swing in a Parliamentary by-election, a dramatic change of winning party or, especially, both, there are some – usually sympathetic to the losing side – who decry the significance of the result. Then there are others – usually sympathetic to the winning side – who herald it as a sign of big political changes to come.
What does the evidence tells us, though, about the predictive power of by-elections, either on the next general election result overall or on the next result in the constituency itself?
By-elections predict general election outcomes, part 1
Research from Paul Whiteley says yes, Parliamentary by-elections do foretell the outcome of the subsequent general election:
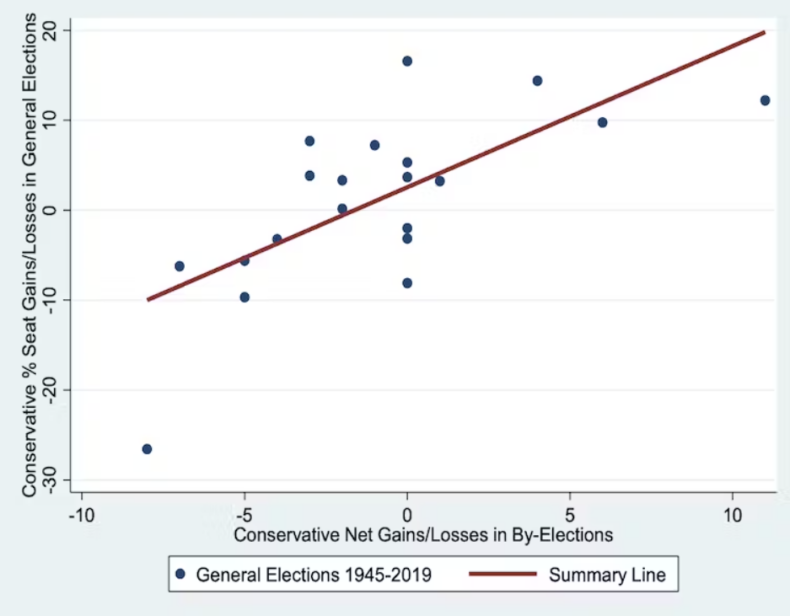
The argument that byelections are no guide to general elections is not true if one looks at a lot of them. To see this, we can examine the Conservative party’s performance in all 474 byelections held in the UK since 1945 and compare them with its performance in subsequent general elections…
The chart shows net gains in byelections since 1945 for the Conservatives compared with net gains in House of Commons seats in subsequent general elections. The relationship between these is very strong (r=0.70)…
The modelling shows that a net win of one byelection by the Conservatives predicts an increase of 1.5% in the number of seats the party wins in a general election. This translates into just over nine extra seats in the House of Commons. Equally a net loss of a byelection reduces their House of Commons seat share by the same amount. This exercise is of course subject to errors, since the relationship is not perfect.
By-elections predict general election outcomes, part 2
Second, we have similar conclusions about the predictive powers of by-elections from Will Jennings (full piece, which is well worth a read, here):
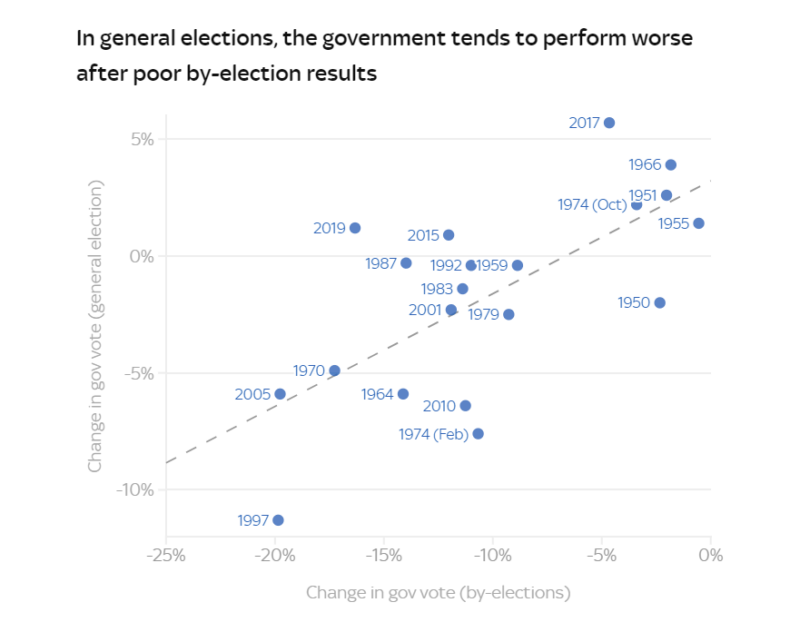
As he writes:
Historically, by-elections have offered a yardstick for the future electoral prospects of governments. Every government tends to lose support in by-elections, but those that repeatedly lose badly tend to fare worse at subsequent general elections.
By-elections partly predict constituency results next time around
Both of those pieces of research are about general election outcomes overall. But what about the result in the constituency itself?
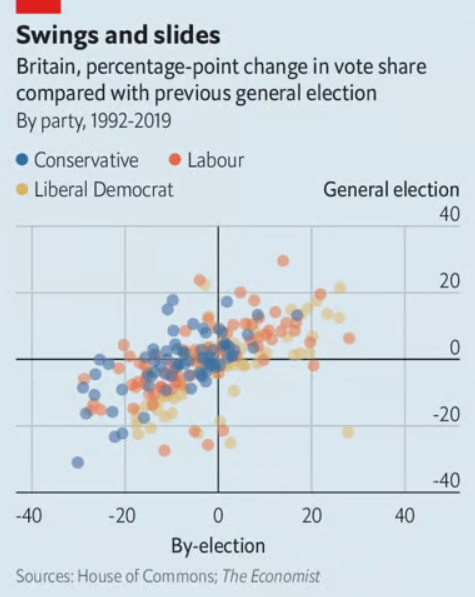
Here we have data from The Economist which again suggests a predictive power:
The Economist built a simple model to predict a party’s general-election vote share in a given seat based on its performance in a by-election in that same seat. As a rule of thumb, roughly half of the change in a party’s vote share is carried over from by-elections to general elections (see chart).
Note: because this analysis looks at vote share changes rather than simply winners and losers, I find it more persuasive than the analysis from Electoral Calculus.
Sign up to get the latest news and analysis
"*" indicates required fields
Might need to factor in length of time between general elections 2015; 2017; 2019 were very close together as were 1974 twice and 1964 and 1966. This left less time for by-elections. Normally there are fewer in early stages of a parliament.
In a regression, as well as the slope of 1.5 (changes to y given changes in x) there is an intercept (what is y when x=0). Here the intercept (where the regression line crosses x=0) is about 2.5, so if Con lose one seat, their % seats actually increases by 2.5-1.5 or 1%. The three seats lost so far indicate that they will lose 2.5-4.5 or -2% of their seats. Then there is also the ‘confidence interval’ to consider, and at a three seat loss the 95% CI ranges from about +2% to -6%. Hopefully there will be another loss or three to come to push that range more firmly into the negative.