The perils of taking one month’s economic figures in isolation
Tony Dolphin’s posts about the state of the economy (made over on Left Foot Forward) are always on my ‘must read’ list because he regularly summaries not only a broad range of economic indicators but also puts them in context, interpreting one month’s figures for one indicator based on both previous months and other indicators.
His recent post on the latest trade data, demonstrates the point about context nicely with his graph on export volumes:
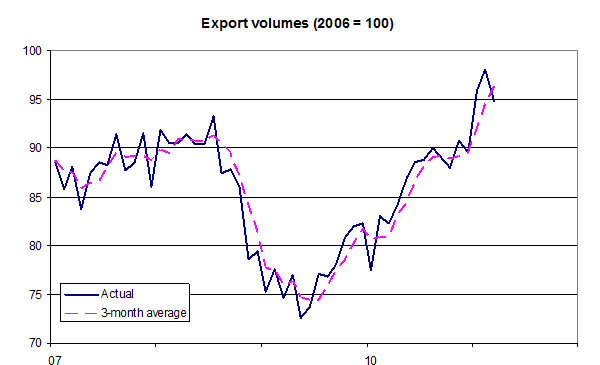
If you look at the decline in 2008-09, there were ten monthly figures from peak to trough. Yet during that decline, four out of the ten months actually showed a rise. Similarly, during the subsequent recovery in trade volumes there have been several occasions when someone could have shouted “disaster! falling exports!” despite the trend being otherwise.
Leave a Reply