20 years of going nowhere: Liberal Democrat gender balance in council elections
Twenty years of progress, followed by twenty years of stalling. That’s the overall picture of Liberal Democrat (and before that Alliance / Liberal Party) progress towards gender equality at local government elections, whether measured in terms of candidates or people elected.
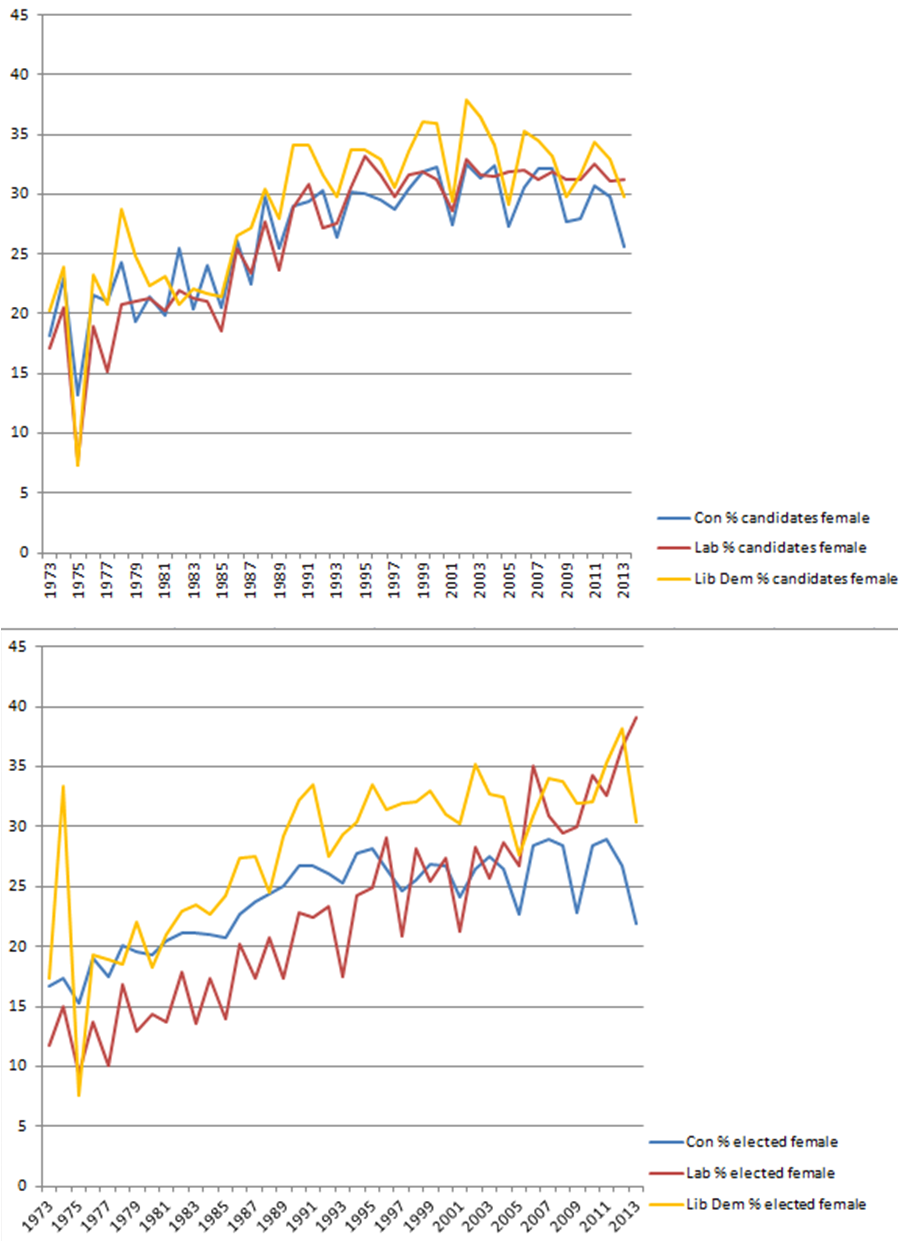
Looking at local elections in England, a mere 20% of the Liberal Party’s candidates were female in 1973 and the figure was even lower, 18%, amongst those elected. By 1991 both figures had risen to 34%. Since then, however, the figures have bounced up and down around a long-term flat trend, with both hitting 30% in the latest figures for 2013.
When it comes to candidates, Labour’s picture is similar – progress in the 1970s and 1980s, followed by stalling since, although it is a better form of stalling as in some years Labour now has a higher female percentage than the Lib Dems. For the Tories the picture is similar, but worse – for the progress and stalling has then turned into decline in the last few years.
When it comes to the proportion of people elected who are female, Labour’s trend departs markedly from the Liberal Democrats. After a brief stalling, Labour then started seeing increases in the proportion of its elected councillors who are female, with such strong growth in the last five years that the party has gone from having the lowest proportion of female elected councillors among the three main parties to the highest, now resting at just under 40%.
Four things strike me about these figures, and the similar long-term patterns in Scotland and Wales:
- It’s worth stressing the point: gender balance amongst the party’s local government base is going nowhere. Although wider society has seen continuing trends towards gender equality, for the party and its predecessors it’s been no progress for 20 years. Society shows no signs of fixing the problem for the party.
- Is it a problem? With a majority of the population and a majority of the electorate being female, the question really is ‘do you think that we’re get the best individuals for the jobs when women make up over half the potential pool but under a third of the number of candidates?’ (And anyway, talking about the best person for the job misses the fact that we’re selecting teams, not just individuals.)
- Whatever the cause, it isn’t the party’s overall membership balance that is the cause, for the party is about 48% female. Slightly less than the population overall, but way higher than the proportions of local councillors and candidates.
- It is possible to bring about big changes in a small number of years, as Labour has shown. That doesn’t mean Labour’s measures are ones Liberal Democrats should be comfortable with, but it does mean that leaving the numbers stalled isn’t inevitable; it’s a matter of choice.
For my previous posts on the topic, some of which include data from outside England, see:
(I thought I’d written similar posts in 2011 and 2012 but seem to have mislaid them somewhere on the internet. If you are better at locating my words than I am then do let me know.)
Thank you once to Colin Rallings and Michael Thrasher of The Elections Centre at the University of Plymouth and authors of British Electoral Facts 1832-2012 for providing the data used in this post.
Some interesting time series there! One striking feature is the seasonality, with a big dip in female candidates every four years. I’d suggest county council elections are the culprit. Perhaps if you’re looking to boost gender balance, the 2017 CC elections are the low hanging fruit most worth concentrating on.
It’s interesting to see that Labour’s overall percentage of female candidates is very similar to the other two parties, but that they seem to be more concentrated in winnable seats – especially in county years. The effect of all female shortlists, perhaps?
To get a better handle on the causality here, ideally you’d need the following series as well (which I’d expect to be in descending order). The big drops would tell you where the problems lie:
1) Female % of party membership
2) Female % volunteers for “paper” candidacies – i.e. where the party expects to lose and has little or no election expenditure
3) Female % volunteers for contested selections (this data would be almost impossible to obtain, however)
4) Female % candidates in winnable seats