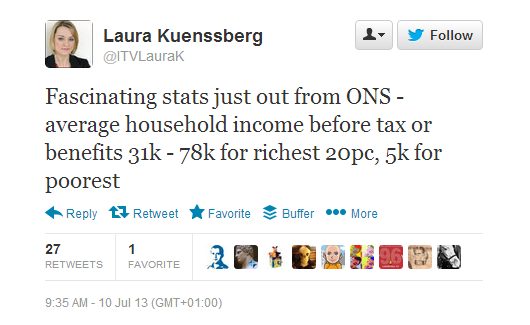
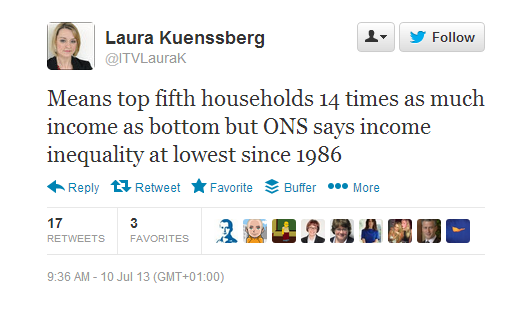
New ONS stats: income inequality at lowest level since 1986
The other figure – or rather long-term trend – that rather caught my eye was on the effective tax rate which people pay. This calculation takes into account both direct and indirect taxes and has been on a long-term downward trend since the early 1980s. Although it’s picked up a bit in the last couple of years, the effective tax rate is at levels last seen in the early 1970s. That’s very much at odds with a lot of the rhetoric about tax burdens.

Leave a Reply