How much does the state redistribute income in the UK?
Here’s a little quiz for you:
a. The richest 20% of households (measured by income) have an annual income that is X times greater than the poorest 20% of households. What is X?
b. The impact of taxes and benefits changes X to Y. What is Y?
Answers below.
Answers:
X: 14.8
Y: 3.8
Or in graphical form:
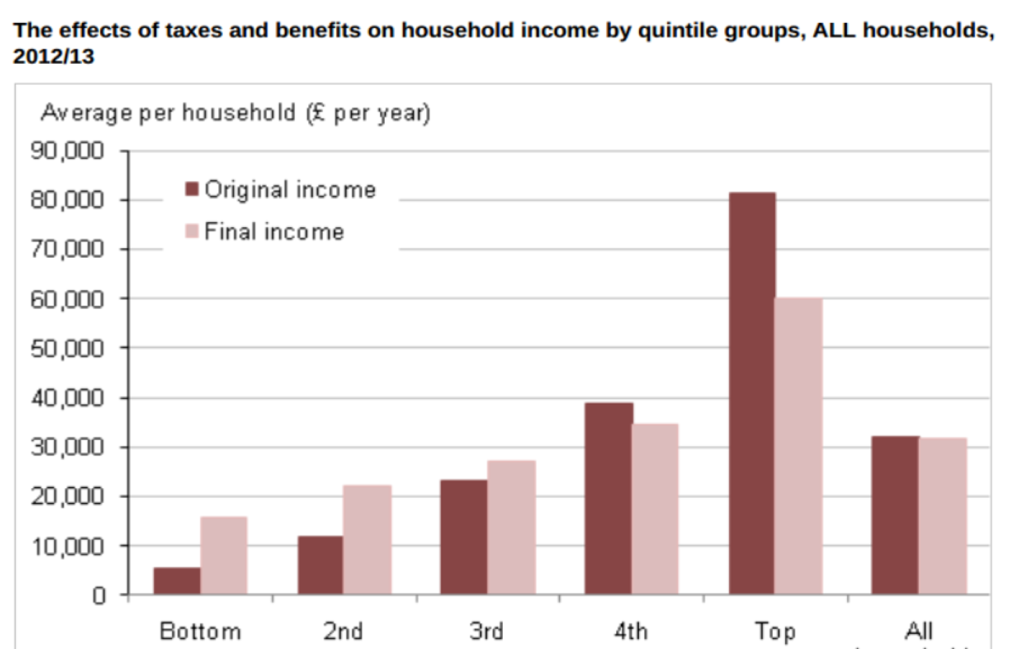
All data taken from the ONS’s The Effects of Taxes and Benefits on Household Income, 2012/13. Tackling inequality is, of course, a major issue that motivates Liberal Democrats. Understanding what does and doesn’t currently happen is key to turning motivation into effective policy.
Leave a Reply